Gain an edge in the market with GannZilla's cutting-edge system.

Maximize your trading potential with Gannzilla – the ultimate Gann tool for traders. Analyze market trends, Forecast future price movements!

Introduction

The aim of this document is to provide new users of Gannzilla with guidance on how to access the main features of the program. This guide does not serve to illustrate how the tools provided by the program can be applied to analyse price markets, since many books, articles and courses are available for that purpose.

This guide was created in response to requests from Gannzilla users in the apparent absence of any official guide issued by the creator of the Gannzilla program.

It is suggested that new users of the program peruse this Userguide in the order presented below, and then perhaps later use the guide as a reference for specific areas.

First opening of the program

The user will see the following window when first opening the program. It displays the default chart which shows a number of modules which may or may not suit the needs of a particular user.

The user may create and save as many different charts as desired, and would typically create a chart to use as a template for each desired research activity. For example, the user may create a SO9 chart template which can then be used as a starting point for

SO9 based research on a particular market. A different template may be created to focus on astronomical research etc.

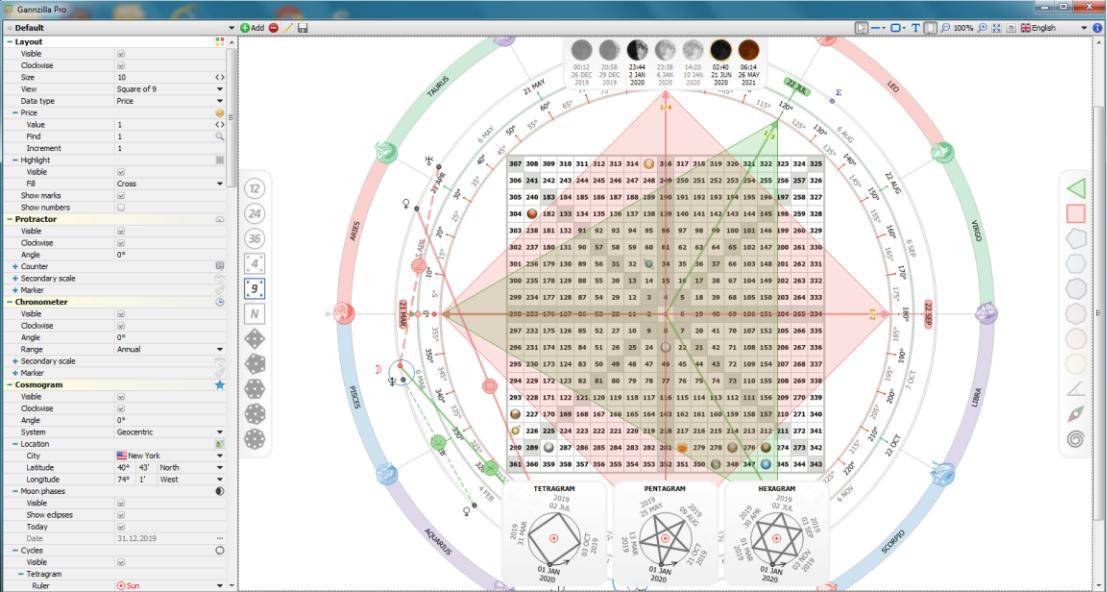
This guide will firstly comment on the various menu items which appear at the top of the Gannzilla window, and then it will show how the user can hide the various modules other than the SO9. By focusing on the SO9, the basic features can be more easily described and many such features are common to all the modules and layouts. Later in this guide, the other modules of the program will be described. As illustrated in the above screen shot, the various modules in the program can be combined as desired by the user.

Menu Items

Chart Active

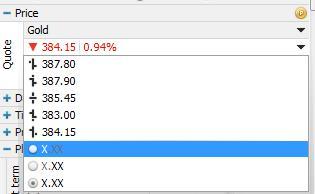
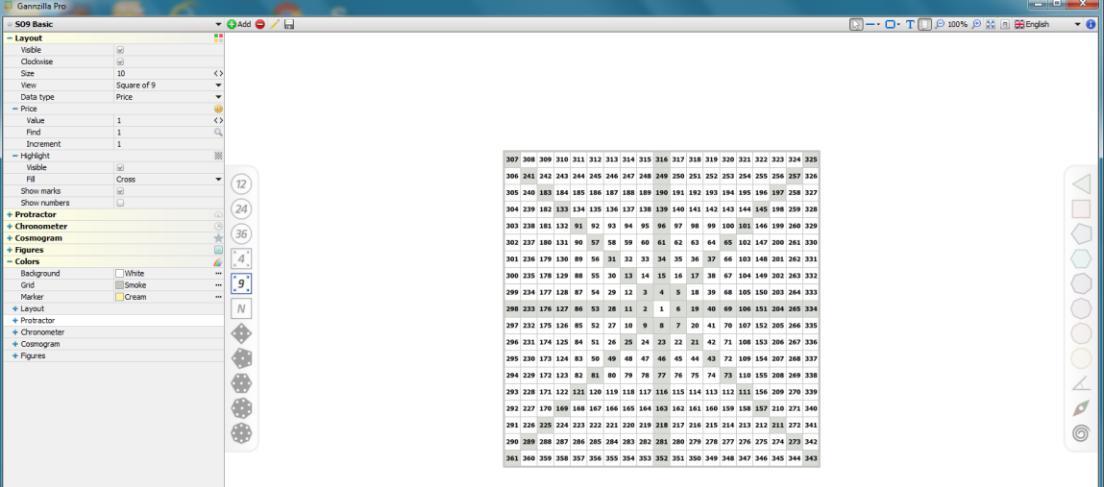
This is a drop-down list of all the saved charts to allow the user to select the desired chart to display. The above screen shot shows a choice of the default chart or a ‘SO9 Basic’ chart created by the user.

The way the charts work is slightly counter-intuitive. When a new chart is added (and given a name eg ‘SO9 Basic’), the program starts with the existing settings. Therefore,
to avoid changing the default settings, the user needs to create (ie Add) a new chart, and then make all the desired changes to that chart while it is visible, and these settings will be saved automatically in the event that the user chooses to display another chart.

Once a chart has been set up in the manner desired by the user (eg as a basic SO9 chart), the user can make a copy of that chart and give the copy another name (eg SO92) as described in the next two topics. The copy can then be used for desired research etc without changing the base version. In this way, a set of templates can be created for reuse by the user.

Add/Delete Charts

This menu item allows the user to add the existing chart to the list of saved charts (with a name given by the user) or delete the existing named chart.

Note that the Insert and Delete keys are alternate ways to add or delete a chart.

Rename and/or Copy Charts


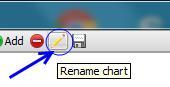
This menu item allows charts to be renamed and or easily copied. The F2 key achieves the same result.

Save screen image

This menu item allows a screen image to be saved (directly into the same folder
which houses the chart files). The Ctrl+S key combination can also be used to save an
image

Cursor

This menu item changes the cursor back to a pointer (eg in situations where the cursor was changed to some other use such as the next menu item which allows lines to be drawn)

Lines


This menu item allows the user to draw lines on the chart such as illustrated in the below screen shot. The line object can be deleted by selecting the item in pointer-cursor mode, and using the delete key. After using this menu item, the user may need to click on the Cursor menu item to regain the pointer-cursor.


Shapes

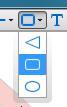
This menu item allows the user to draw shapes on the chart such as illustrated in the
below screen shot. The shape object can be deleted by selecting the item in pointercursor mode and using the delete key. After using this menu item, the user may need to click on the Cursor menu item to regain the pointer-cursor.

Label

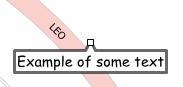
This menu item allows the user to draw labels on the chart such as illustrated in the below screen shot. The item can be deleted by selecting the item in pointer-cursor mode and using the delete key. After using this menu item, the user may need to click on the Cursor menu item to regain the pointer-cursor.

Hide Tools

This menu item toggles the display of the icons for the draw tools (which appear on

the left and right of the main chosen item). The following screen shots show the tool
icons.


Zoom In/Out

This menu item allows the user to zoom in or out on the main chosen item (ie make it
appear larger or smaller). When in pointer-cursor mode, the minus key (-) will zoom
out and the plus key (+) will zoom in. The star key (*) will restore the zoom to 100%.
The minimum zoom is 50% and the maximum is 150%.

Full Screen

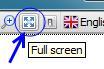
This menu item allows the user to view the main chosen item in full screen mode. The F11 key will achieve the same result. The Esc key (ie escape) will exit the full screen mode.

Connection Settings

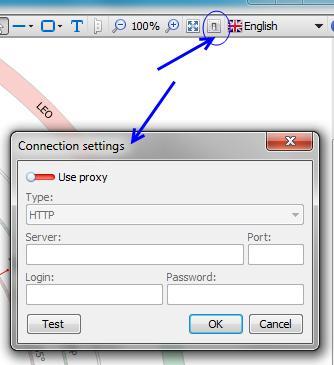
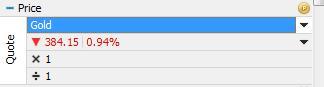
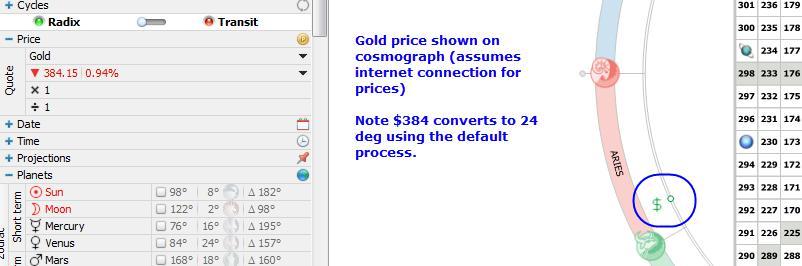
This menu item allows connection settings to be set, but this should not be required for the relevant market prices if the computer is connected to the internet when the program is run (see Price under the Cosmogram module below). The F9 key can also be used to access the connection settings dialog box.

Hiding modules in the default chart other than the SO9

Chart Active

The following setting changes can be made to hide the modules in the original default chart so that only the SO9 layout is visible.

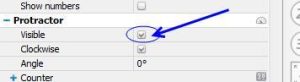
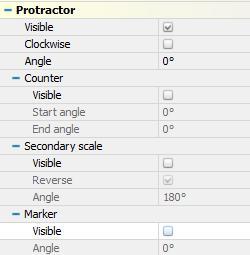
This means de-selecting the “Visible” property of the following modules to be hidden such as shown in the following screen shot for the Protractor module which is shown with Visible set to ‘on’. The parameter settings for each module are located on the left hand side of the main Gannzilla window and has its own scroll bar.

The modules to hide are:

  • Protractor
  • Chronometer
  • Cosmogram
  • Figures (either hide all or hide individually eg the triangle and square)

This should result in the following appearance of the main Gannzilla window (not in full screen mode):

Working with the SO9 layout

The comments in this section of the guide apply specifically to the SO9 layout but are also relevant to other modules and layouts (eg Circle of 12, SO4 or hexagon etc).

If the user wishes to copy the displayed chart at any stage (eg to use it as a template) then he or she can click on the Rename Chart menu item which has an option to create a copy. The F2 key can also be used to rename and/or copy the chart.

Cosmetics - Colours

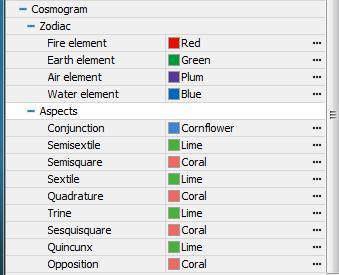
Various colour choices are available as parameters (see under the heading ‘Colors’ towards the end of the parameters listing on the left-hand side of the Gannzilla window, as shown in the below screen shot).

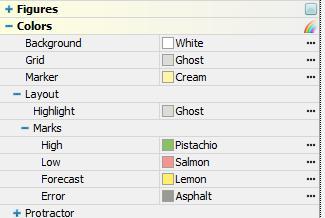
Most items are self-explanatory however the items headed ‘Highlight’ and ‘Marks’ are described below.

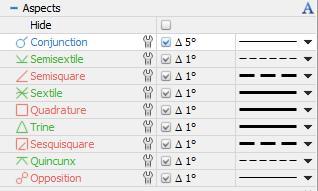
The item headed ‘Highlight’ refers to the colour for the Cross or Level highlights as shown in the following two screen shots.

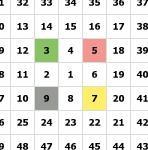
The items headed ‘Marks’ refers to the highlights made by the user when clicking on a chosen number in the displayed layout (ie in this case the SO9 grid of numbers). The colours for High, Low, Forecast and Error will appear in rotation as the user repeatedly clicks on the chosen number. Note that to clear all highlights from a given number, the user needs to right-click on the number. 

To clear all the marks in one step (ie where more than one number is highlighted), then the user can use the F8 key. If the user wishes to hide the highlights rather than delete them, there is a parameter setting described in the next part of this guide ‘Layout parameters’. Below is a screen shot showing use of the four default colours.

Layout Parameters

The following screen shot shows the various parameters relevant to layouts such as the SO9. These parameters are more fully described below.

Visible

This parameter will allow the layout to be made visible or hidden. Hiding the layout may suit working with other modules as shown in the following screen shot of the cosmogram module and sub-modules.

Clockwise

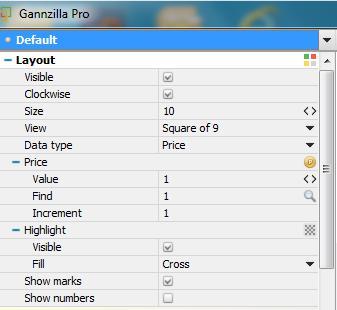
This setting changes the direction in which the numbers rotate as shown in the
following two screenshots.

Size

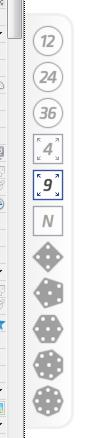
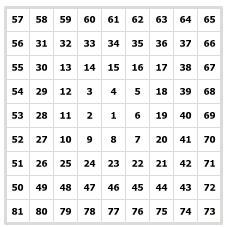
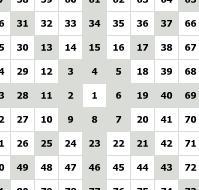
This sets the number of rings or levels (including the central starting point). The
following screen shot shows the layout display set to size 5.

Caution: A quirk of Gannzilla is that if the size is reduced, any cells marked on levels hidden by the reduced size will lose their marked status (ie increasing the size to reveal the levels will display all cells on the higher levels as unmarked).

View

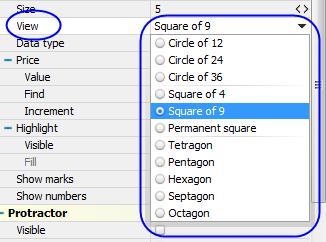
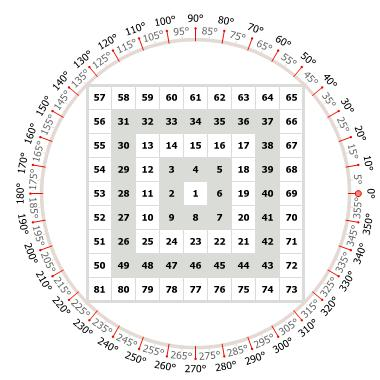
This parameter sets the layout that will be displayed (ie only one at a time). The
different layouts available can be seen in the following screenshot.

Note that the desired tool can also be chosen using the Tools icons (which can be

shown/hidden using the menu item described earlier).

Data type

This parameter determines what data is displayed in the layout eg price, date, time etc. The following screen shot shows the choices available.

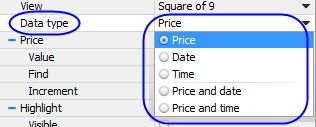
The following screen shot shows the display of the Price and date combination. Note that subsequent parameter choices such as shown below for price (eg value, find, increment) will automatically change depending on the data type chosen here (ie date and time choices will appear if either such data type is chosen).

Price value

This item allows the initial value of the chosen data type to be set (here shown as price but could apply to date and/or time if they are chosen as data types – see above).

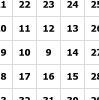
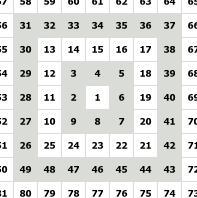
The following screen shot shows the layout when the initial value is set to equal 9.

Price find

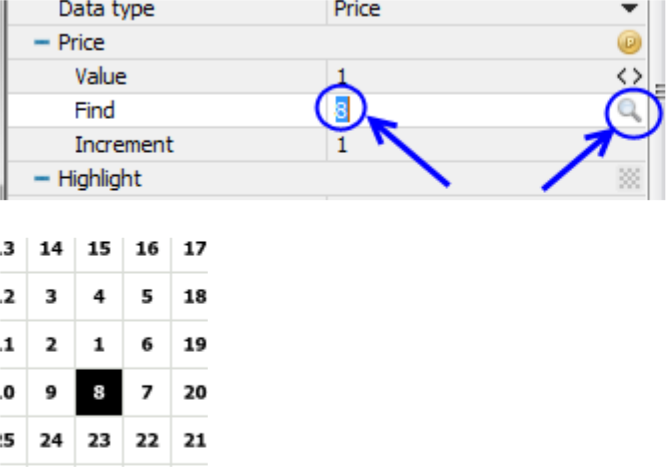
This will highlight the desired number in the layout. Enter the desired value and click on the magnifying glass icon and the relevant number will be highlighted as shown in the following screen shots for the number 8. To un-highlight a found number, simply click on the number.

Price increment

This setting determines the value by which the numbered cells will increment. The following screen shot shows the cells in the layout incrementing by the value of 3 (rather than the default increment of 1). Also see the ‘Show numbers’ parameter below which allows the user to see the 1×1 number of each cell where increments other than 1 are chosen). 
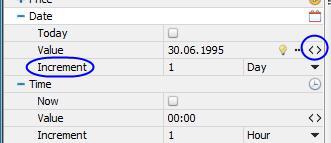
It should be noted that negative increments can be used (which may be useful if the initial start value is set to a price high).

Highlight visible / fill

As noted in the Cosmetics-Colours section above, ‘Highlight’ refers to the feature where a cross or the levels of the layout can be highlighted as shown in the following screen shots.

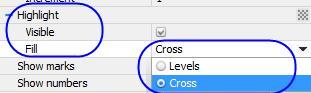
Example of the Cross highlight being visible:

Example of the Levels highlight being visible:

Show marks

The reference to ‘Marks’ refers to the highlights made by the user when clicking on a
chosen number in the displayed layout (ie in this case the SO9 grid of numbers). 

The colours for High, Low, Forecast and Error will appear in rotation as the user
repeatedly clicks on the chosen number. Note that to clear a number of highlights, the
user needs to right-click on the number. 

To clear all the marks in one step (ie where more than one number is highlighted), then the user can use the F8 key. If the user wishes to hide the highlights rather than delete them, then this ‘Show marks’ parameter may be used to hide or re-show them as the case may be.


Note that the colours of each of the four different marks may be set as described
above under the heading ‘Cosmetics-colours’. Below is a screen shot showing use of the four default colours.

Show numbers

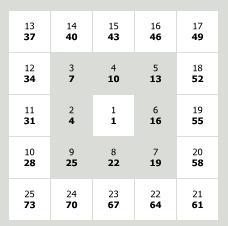
This parameter allows the user to see the 1×1 number of each cell in the layout (ie useful where increments other than 1 are chosen).

Other features useful in connection with layouts (eg SO9)

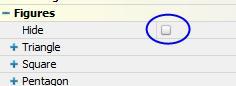
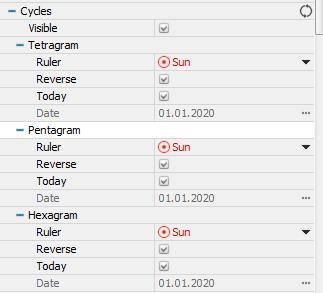
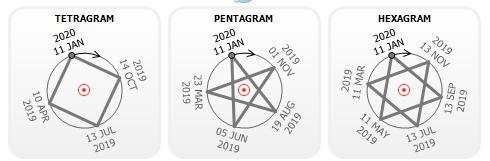
There are a number of ‘figures’ which can be used with layouts and examples of these are described below (in no particular order). The complete list of figures can be found
in the list of parameters on the left hand side of the Gannzilla window (after the Cosmogram module). Note that figures may be made visible/invisible according to  their individual parameters and there is also a setting which allows all chosen figures (ie the figures the user has decided to make visible) to be made visible or invisible as desired as per the following screen shot.

Also note that the colours for the figures may be set under the parameters section headed ‘Colors’ (sub heading ‘Figures’) which is the last major area of the parameters section on the left hand side of the Gannzilla window.

Locator Figure

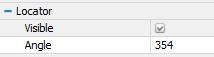
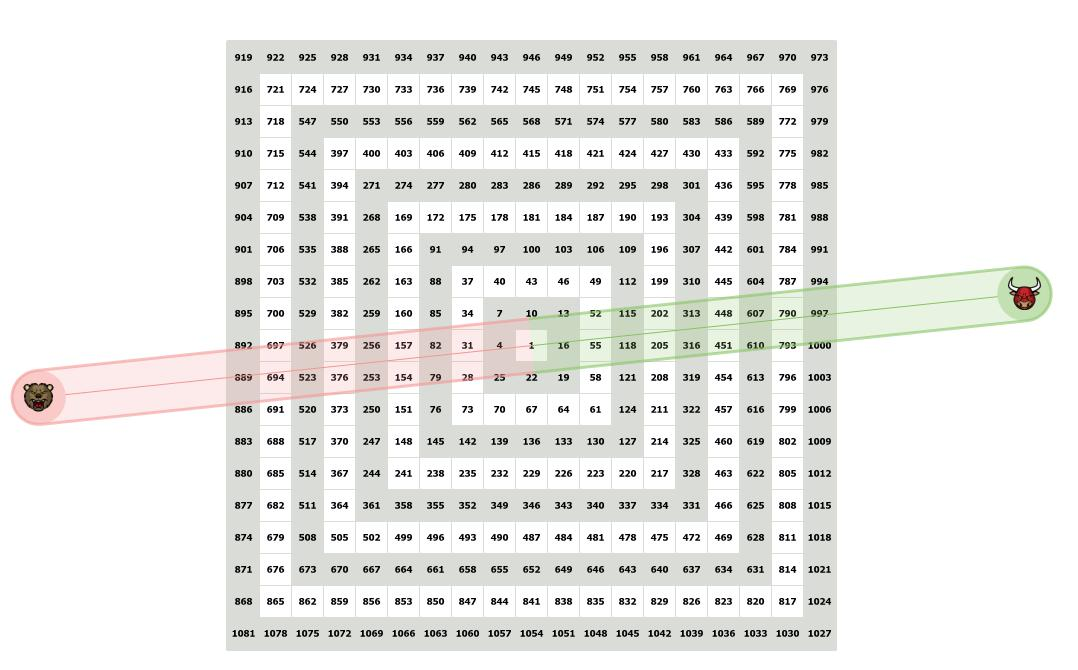
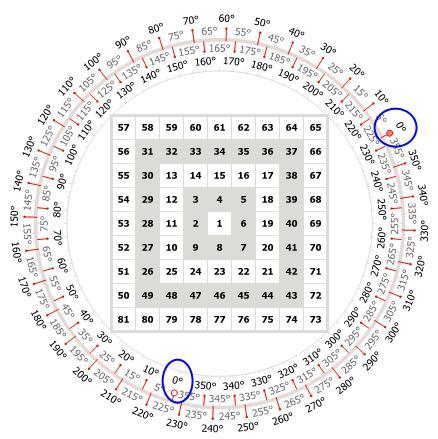
This figure is a swing line centred in the layout and which can be displayed at any desired angle as shown in the following screen shots. The angle can be set in the parameters for the figure or by a drag and drop of the Bear/Bull icons which appear at the ends of the swing line.

Also see the Protractor module described below which includes a marker line that the user can place at any angle from the centre either by setting the angle parameter or dragging the icon for the line to the desired point on the protractor circumference.

Triangle figure

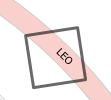
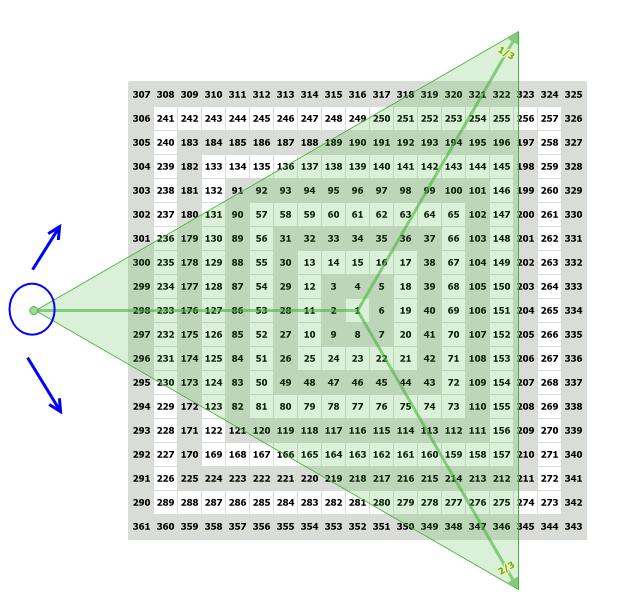
This and the square figures may be useful to Gann students given the many times he stressed the importance of triangles and squares.

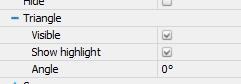
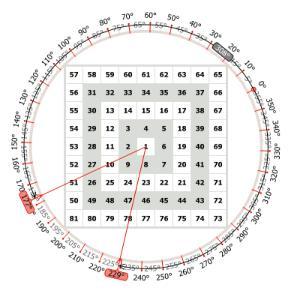
As shown in the following screen shots, the user can set the visibility (ie show or hide), the highlight and the angle. The angle may be set in the parameters area or by dragging the base pointer (circled in the screen shot below). As mentioned above, the colour may be set in a separate area of the parameter settings headed ‘Color’.

Note that the triangle and square figures may be particularly useful in conjunction with the Cosmograph module.

Vector figure

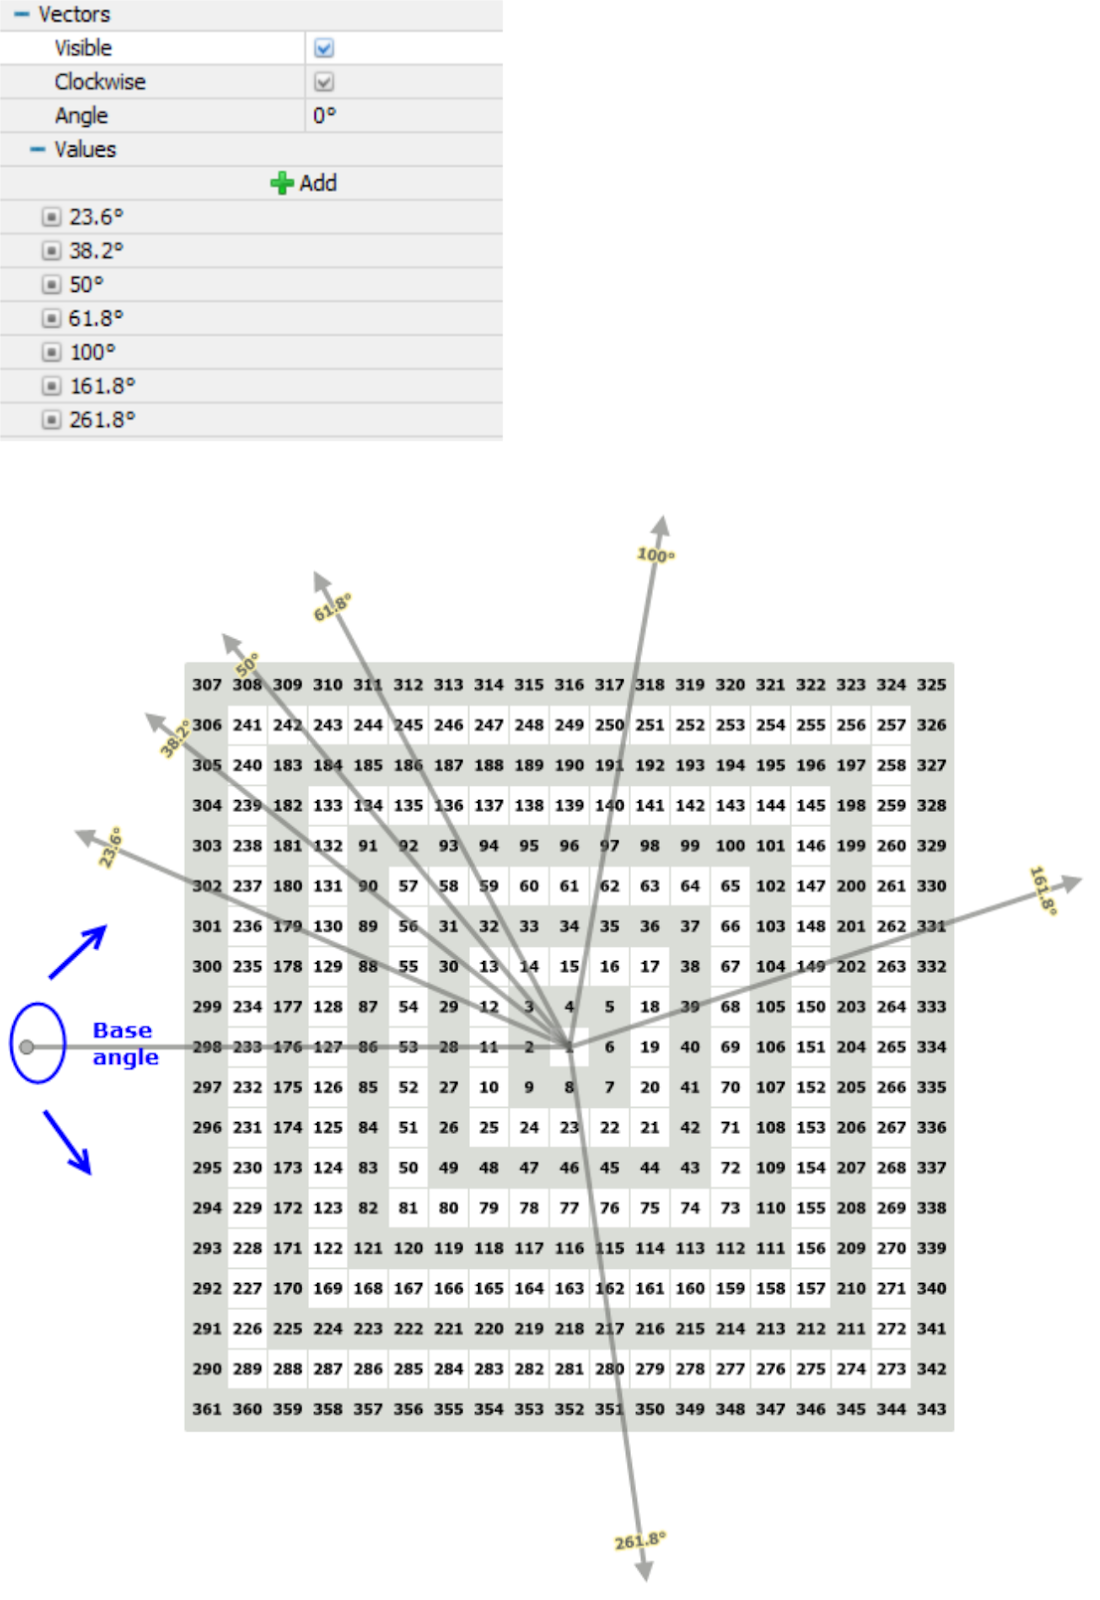
This figure shows vectors based on an angle which the user can set by either the
parameters or by dragging the icon for the base angle as shown in the following
screen shots. Note that the user can display/hide the default vectors or add vectors at
custom angles and also have the vectors calculated clockwise or anti-clockwise.

Also see the Protractor module described below which includes a marker line that the user can place at any angle from the centre either by setting the angle parameter or dragging the icon for the line to the desired point on the protractor circumference.

Other figures

There are a number of other figures (geometric shapes) which operate in the same manner as illustrated above. These are shown in the following screen shot.

Vortex figure

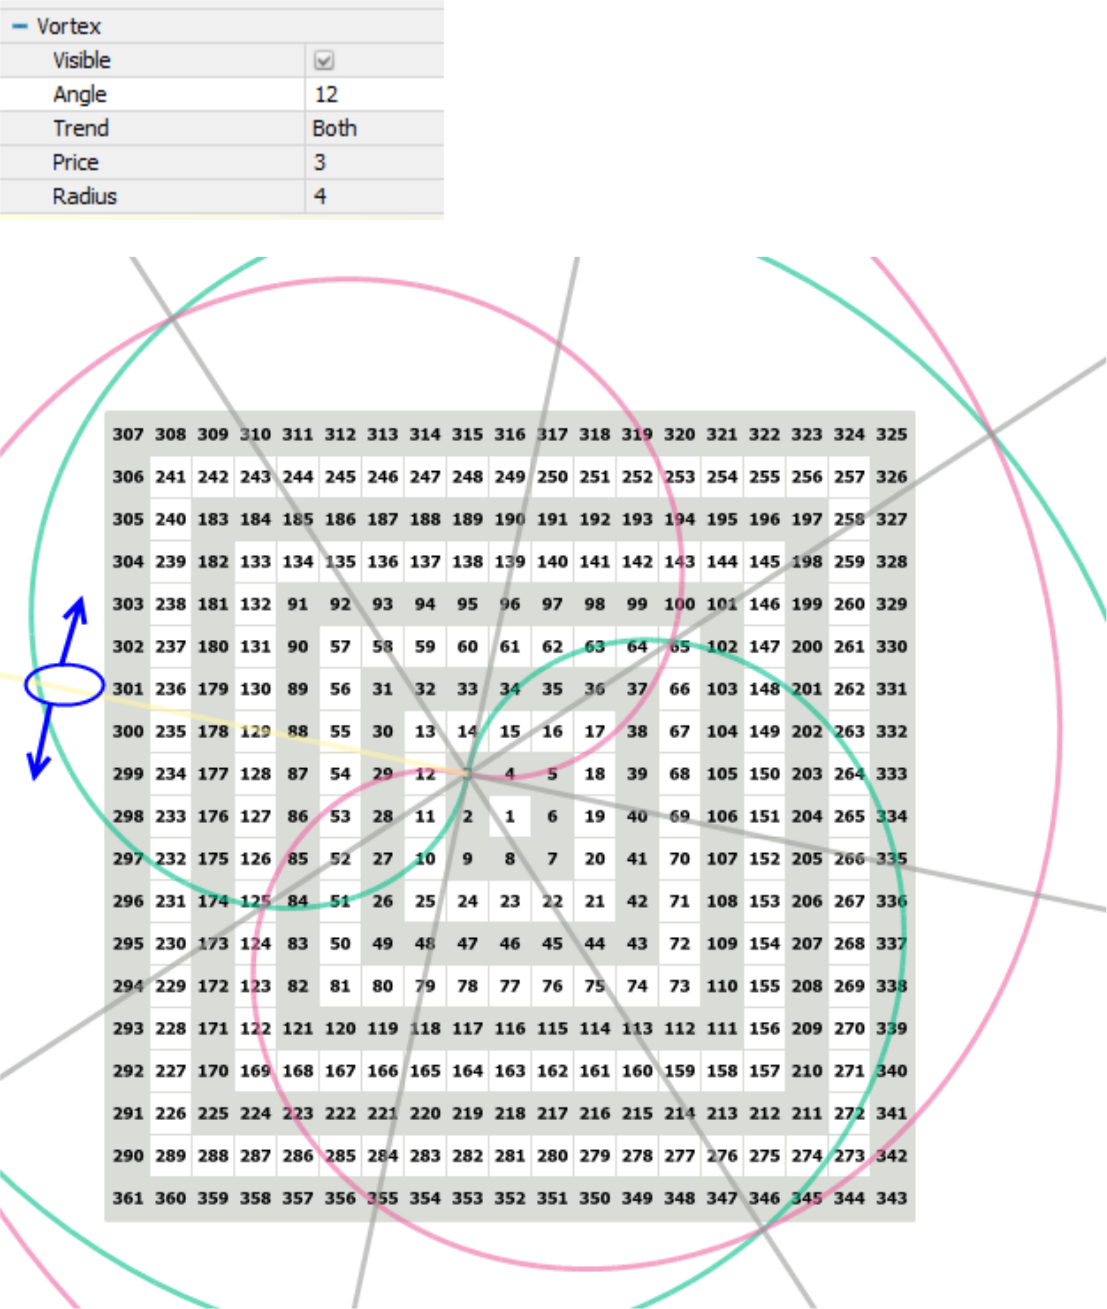
This figure displays Fibonacci bull and/or bear vortex(es) from a chosen centre as
shown in the below screen shots.

The user can vary the angle (either through the parameter settings or dragging the base line marked in the below screen shots) as well as the start cell (eg cell 3 below) and the radius (eg set to 4 below).

The colours can be set in the ‘Colors’ section of the parameters with separate choices available for the bull, bear and axes.

Other Modules

In this part of the Userguide, the protractor, chronometer and cosmogram modules will be considered.

Protractor Module

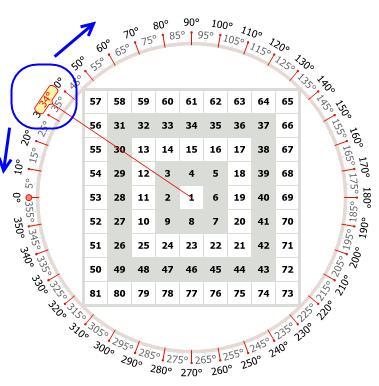
This module allows one or two protractors to be displayed, as well as a counter and a marker as illustrated in the following screen shots.

The start point (ie zero degrees) can be set in the parameters or dragging the icon at the end of the zero line.
Two independent wheels can be displayed at the same time (each wheel can have its direction as clockwise or anti-clockwise).
A counter can measure and display (at the mid point) the angle separating two vectors as shown in the following screen shot (the start and end points can also be set by dragging the icons at the ends of the vectors).
A marker can be set by the user either using the parameters or dragging the icon at the end of the marker vector.

Chronometer Module

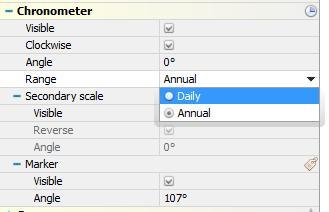
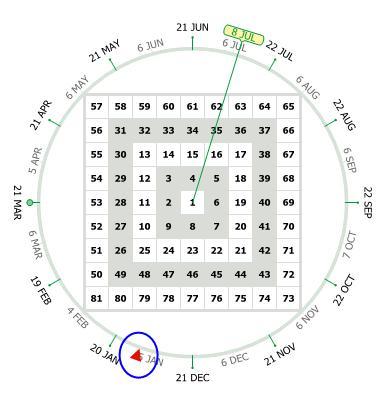
This module is similar in operation to the protractor module described above. The only practical difference is that it includes a parameter to choose a daily range or an annual range.

In the following screenshot, the current date/time is marked with a triangle icon (the user has set the marker to July 8).

Cosmogram Module

This module depicts the positions of the planetary bodies in relation to the numbers on the chosen layout (eg SO9), as well as performs many useful functions and displays information on the planetary bodies. The main features of the module are outlined below.

There are two sub-modules which can be displayed either independently or together in combination with the main module.

Moon phase sub module

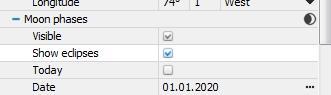
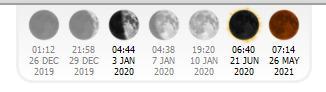
This sub-module displays the dates of the main phases and eclipses around the current date or a date set by the user.

Cycles sub-module

The second sub-module is called “Cycles” and displays the tetragram, pentagram and hexagram dates (or reverse dates) for the chosen base planets and dates as illustrated in the below screen shots. If a particular set of dates is not required, the planet choice for that set (eg tetragram) can be set to ‘none’. The base date for each cycle can be set by the user. The whole set of desired cycle dates can be made visible or hidden through a single parameter.

Cosmogram main module

The main parameters for the main part of the cosmogram module are shown in the following screen shot (some parts are not expanded but covered later in this guide).

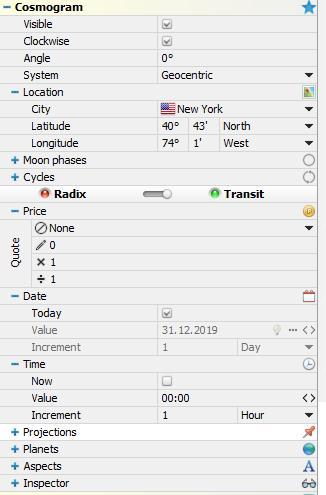
Most of the parameters are self explanatory and work similarly to equivalent parameters for the other modules explained above. The below comments cover
certain features which may not be readily apparent.

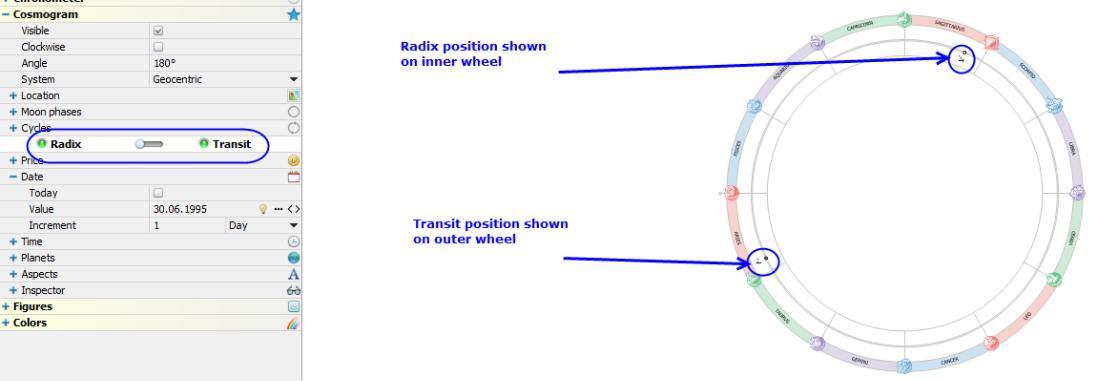
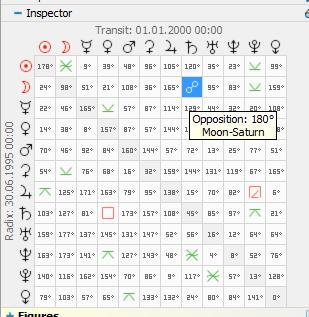
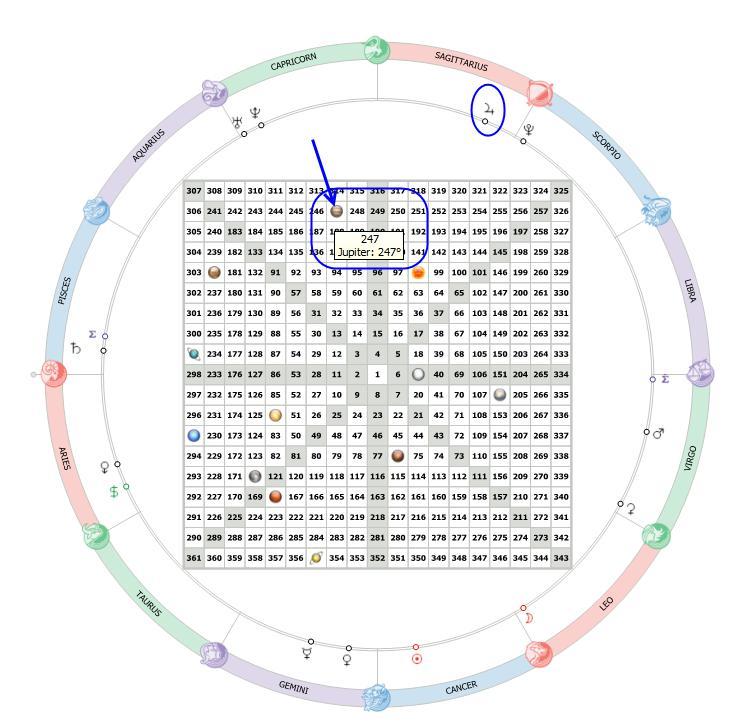
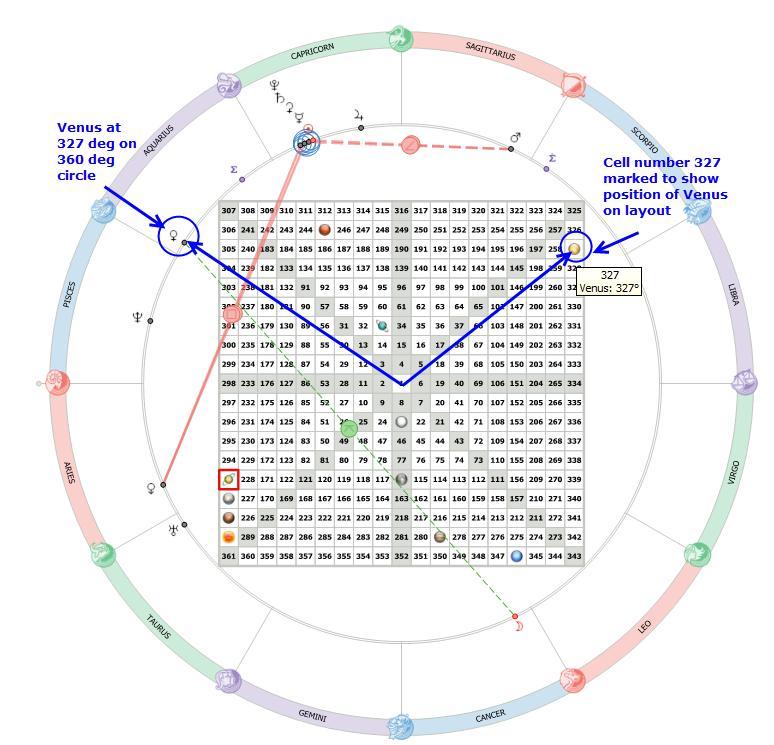
As a broad comment, the idea behind this cosmogram module is to allow users to see
the positions of the solar system bodies (ie planets) in relation to the chosen layout.
As a basic example, the following screen shot shows the planets positioned around the
layout in a circle (representing the 360 deg approach used by astronomers and
astrologers) and also where each planet’s longitude degree position would fall on the
layout itself (eg in the example, the position of Venus is 327 degrees and the cell for
the number 327 is marked with the Venus icon).

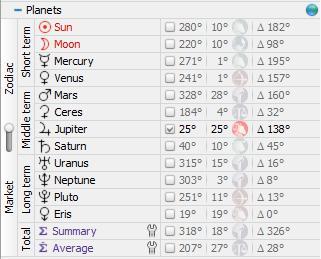
One approach for trading may be that if a top pivot occurred at 327 price when Venus
was at 327 degrees, then if price were to reach another number on the layout geometrically connected to the planet positions, the probability for a change in trend
may be higher (eg if price were to reach 304 or 259 in the below example then a trader may look for other techniques to confirm a bottom). 

There are almost countless approaches a trader could research using the layouts and cosmogram capabilities and, as mentioned above, there are many books and articles with suggested methods to start with.

Setting the desired dates and display

Setting the dates and wheels displayed may not be intuitive for some users, especially if they do not have a background in astronomy or astrology.

There are three date possibilities to be aware of. First is the radix date (some may refer to this date as the natal or beginning date). Second is a transit date of interest (eg maybe the date or a high or low pivot). The third date is the date of ‘today’ ie the date at the time of using the program.

For this guide, 30/6/1995 will be used as the radix date (eg an initial low pivot),1/1/2000 will be used as the transit date of interest (eg a subsequent high pivot) and the date of ‘today’ is 11/1/2020.

The following screen shot shows the buttons available to set the parameters.

The general logic behind the buttons and options appears to be broadly as follows:

  1. Clicking on the Radix and Transit buttons changes their colour between green and red.
  2. If those buttons are both set to red, then the cosmogram main feature will be hidden. This would be useful in circumstances where the user only wants to see either or both of the abovementioned two sub-modules of the cosmogram (ie Moon phases and Cycles)).
  3. Setting either to red will hide the relevant values (eg setting Radix to red will hide the radix date).
  4. To set either the radix or transit date of interest, first ensure that the relevant button is set to green (eg in the above screen shot, the Radix button is green and the radix date value can be input by the user as 30/6/1995 in this example). The slider item will normally go to the correct setting when the Radix or Transit buttons are double-clicked but if not, see item 7 below. 
  5. The date can be input by typing directly into the date area or using the calendar feature as shown below. 
  6. There is also an events list which allows users to choose from a list of significant historical events, also illustrated below.

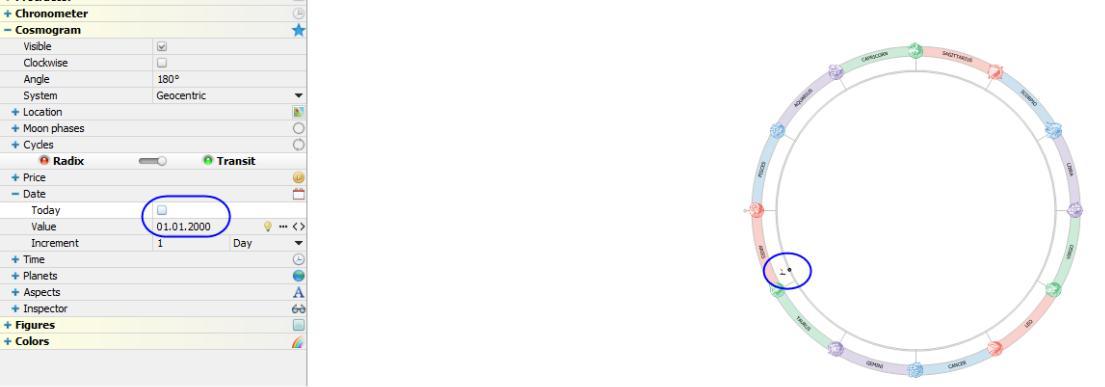
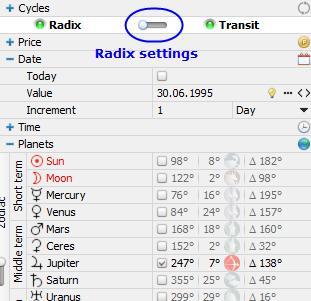
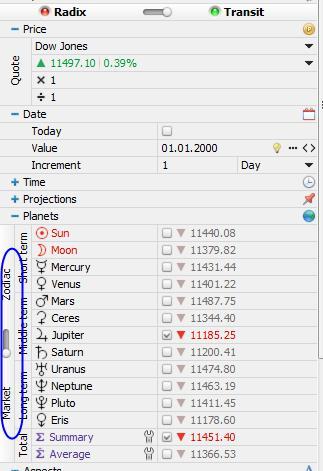
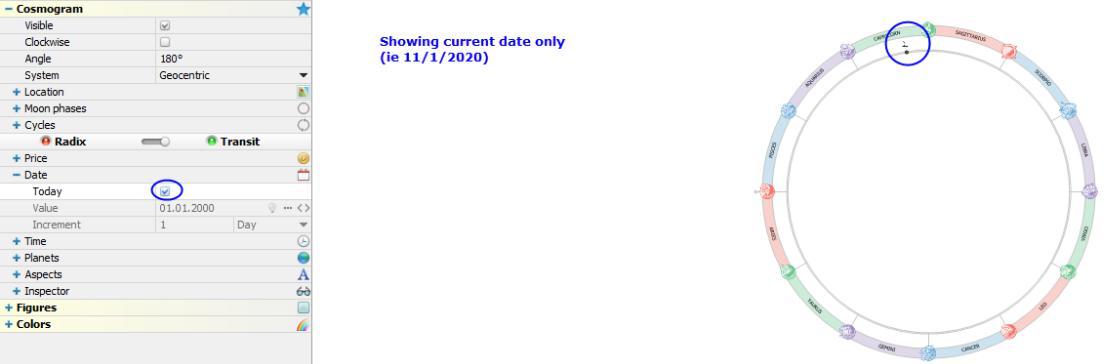
Either or both of the radix and transit options can be used to select the current (ie today) date instead of the radix or transit date. 

The following screen shot shows the radix setting where the date for today will be used instead of the radix date (ie selecting the ‘Today’ option will override the date input for the radix).

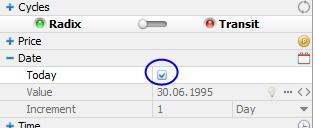
The same logic would apply for the transit date.

Where the user would like to see a combination of dates displayed (eg both the
radix and the transit on an inner and outer wheel), then both buttons need to be set to
green.

Note that if the ‘Today’ option is chosen for either radix or transit dates (or both), then the value for ‘Today’ will be used instead of the radix or transit as relevant.

The following screen shots show some possibilities using Jupiter to illustrate (ie all the other planetary objects are hidden for the sake of clarity).

Showing just the current date (here 11/1/2020)

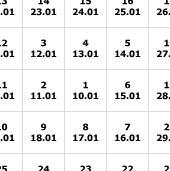
Showing just the transit date of interest (here 1/1/2000)

Showing both the radix date (here 30/6/1995 on the inner wheel) and the transit date of interest (here 1/1/2000 on the outer wheel)

Note that the slider icon between the radix and transit buttons can be used to access
the relevant detailed settings for each option. 

For example, to set the radix date and/or any of the options relevant to the radix display such as which planets should be shown etc, the slider needs to be set to the radix side as shown below. 

Similarly for the transit settings, the slider needs to be set to the transit side. This slider will normally set itself to the logical setting when either the Radix or Transit buttons are double-clicked.

General cosmogram settings

Parameters are available to set the cosmogram direction (ie clockwise or anticlockwise), the starting point (ie relative position of the zero degree point), the coordinate system used (ie geocentric or heliocentric), and the desired location. 

The location co-ordinates may be chosen from a list or input manually as shown in the following screenshots –

Time settings and interval increments

The time settings may be set similarly to the date settings noted above.

An additional feature not covered above is that the user may use the parameter icons to increment the cosmogram by intervals set by the user. 

For example, if the user wishes to see the effects of incrementing the cosmogram by daily intervals, the user may set the increment parameter to ‘Day’ and then use the < and > icons to see the effects directly in the Gannzilla window (ie without having to go through a tedious process of entering new dates).

Price Settings

The price of certain markets may be displayed on the cosmogram, provided that the computer is connected to the internet at the time of selecting the market.

There are also parameters to multiply or divide the price if desired.

For example, the price of gold at the radix time in our example is around $384 which under the default settings is converted to 24 degrees (ie 384-360 = 24). The user may prefer that this be shown at twice the value, which gives 48 degrees.

The user may choose from a variety of prices being the open, close, high, low and mid (the 0.94% shown on the screen shot is the percentage price change from the prior day with the direction indicated by the triangle, in this case down).

The following screen shot illustrates how the price is shown on the cosmogram using a ‘$’ character. Note that the price can be chosen to appear on either or both of the radix and transit settings.

Planet settings

Using the parameters, the user may choose which planets to display and also view key information in relation to the planets such as its degree position (geocentric or heliocentric as set in the general settings for the cosmogram) and also the degree gap between the dates chosen using the Radix and Transit parameters mentioned above.

The following screen shot shows that Jupiter is the only chosen planet and its radix position is at 25 deg which is 138 degrees apart from its transit position (as chosen by the user).

The summation (named Summary in the screen shot) and average positions of chosen planets can also be selected for display on the cosmogram (both for the Radix and/or Transit dates). The user can select which planets to include in the calculation of the summation or average. The following screen shot shows five outer planets chosen for the summation.

The user can choose to display the market price equivalents of the planetary positions by clicking on the slider icon as show below. The degree settings are then converted to modulus 360 depending on the chosen market price. In the below example, the market price is the Dow Jones index which was around 11,497 at the time of the chosen transit date. 

For example, 11,160 (ie 31×360) was added to Jupiter’s 25 degree position to display a relevant price for Jupiter of 11,185.

Aspects

The most commonly used aspects are available to the user, including orb settings for
each aspect category. For example, all conjunctions can be set to have an orb of 5
degrees and either displayed or hidden as desired. 

The user can also decide which planets to include in each of the aspect types displayed. For example, the user could choose to only view conjunctions between Jupiter and Saturn and ignore all conjunctions between other planets.

The line types are also able to be selected for each aspect type. Colours may be
chosen under a separate section of the parameters area headed ‘Colors’.
All aspects can be hidden or made visible with one click as the user chooses.

It should be noted that aspects shown on the cosmogram will include aspects
involving the positions of the price, and also the summary and averages of the planet
positions, if they are chosen in the list of planet objects mentioned above.

Inspector

The inspector section of the parameters appears intended to display the relationships
between the radix and transit planet positions in a table format with the most popular aspects highlighted. 

There may be a bug in the existing version since it appears that the aspects may be, say, transit to transit rather than transit to radix (as shown in the following screen shot which displays the opposition aspect between the transit (1/1/2000) Saturn and Moon rather than transit Saturn and radix Moon as the labels indicate).

Note that the user can hover the mouse pointer over a marked aspect to see the
number of degrees as shown in the following screen shot.

Projections

When a layout (eg SO9) is chosen to be displayed in conjunction with the cosmograph, then the parameters area will show a ‘Projections’ heading which allows the user to choose which planets should have their cosmic positions marked on the layout cells.

 For example, if Jupiter is at 247 degrees as in our example, then the cell numbered 247 will display an icon for Jupiter and if the mouse pointer hovers above the cell it will reveal the details as shown on the following screen shot.

Following is a screen shot of the Projections parameters area (in this case with all the planets selected for display).

Colour choices

The main colour choices for the cosmogram are found in the ‘Colors’ section of the parameters which are on the left side of the Gannzilla window and cover the zodiac elements and planetary aspects as shown in the following screenshot.