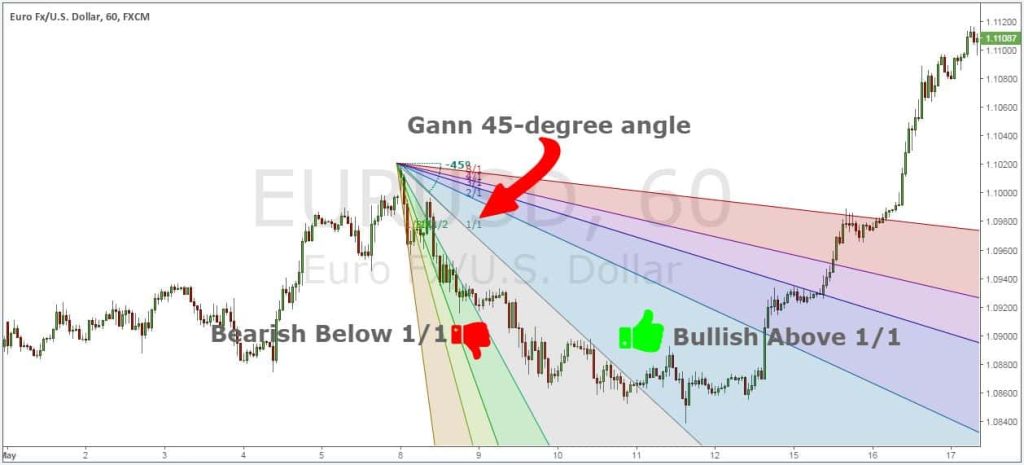
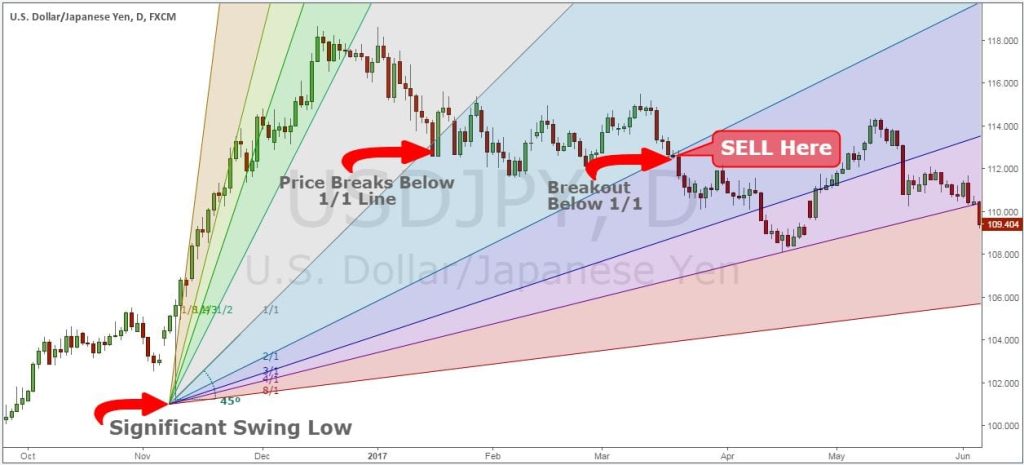
Gann fans are a form of technical analysis based on the idea that the market is geometric and cyclical in nature. A Gann fan consists of a series of lines called Gann angles. These angles are superimposed over a price chart to show potential support and resistance levels. The resulting image is supposed to help technical analysts predict price changes.
What is Gann Fan?
The Gann Fan is a technical analysis instrument consisting of 9 lines that indicate support and resistance levels, each fixed at a specific degree with the 45-degree line being the primary Gann level. William Delbert Gann, a trader in the 20th century, developed this tool, which forms a fan on a chart due to the different levels.
By plotting the Gann Fan levels from significant highs and lows, traders can identify potential support and resistance levels, and the nine diagonal lines represent different angles with their own forecasting significance. This tool is widely used for analyzing market trends and potential breakouts in financial instruments like stocks, futures, options, currency derivatives, and commodities, based on the assumption that securities prices follow geometric patterns.

How does the Gann Fan Work?
- The Gann fan consists of a series of angled lines and was created by W.D. Gann.
- The lines extend into the future and are drawn at various angles including 45, 82.5, 75, 71.25, 63.75, 26.25, 18.75, 15, and 7.5 degrees.
- Gann believed the 45-degree angle to be the most important.
- The Gann fan originates at a low or high point and shows potential areas of future support and resistance.
- The Gann Fan tool has multiple uses for traders and their strategies.
- One use is identifying potential support and resistance levels through Gann angles, which can indicate a possible price bounce or reversal.
- Another use is measuring the strength of a price move; a steep angle indicates a strong move, while a shallow angle indicates a weak move.
- Traders can also use the Gann Fan to predict potential price targets by measuring the angle of a move and applying it to the trendline.
- Lastly, the Gann Fan can be used to identify trend strength; a steeply angled trend that is progressing quickly is considered strong, while a shallowly angled trend that is progressing slowly is considered weak.
The Gann fan tool consists of 9 different angles, with the 45-degree angle or the 1/1 line being the most important. Each Gann angle has a corresponding line derived from it, with 4 Gann angles above the 45-degree angle and 4 below.
- 1/8
- 1/4
- 1/3
- 1/2
- 1/1 – 45 degree
- 2/1
- 3/1
- 4/1
- 8/1
More Understanding of Gann Fan
The Gann fan is a technical analysis tool that helps traders determine trend direction and strength. The tool consists of angled lines drawn above and below a central 45-degree line. Traders draw a Gann fan from a central 45-degree angle line that extends out from a specified trend reversal level. The Gann fan can be used to see support and resistance levels extended into the future.
The 45-degree line is the primary indicator and is known as the 1:1 line. The price will rise or fall at a 45-degree angle when the price moves up/down one unit for each unit of time. All other lines in the Gann fan are drawn above and below the 1:1 line. Traders can use a varying number of lines above and below the 1:1 line in a Gann fan chart. The other angles are associated with 2:1, 3:1, 4:1, 8:1 and 1:8, 1:4, 1:3, and 1:2 time-to-price moves.
The 45-degree angle line of the Gann fan should be aligned with a 45-degree angle on the chart. To find the 45-degree angle, use the degree angle tool on your charting platform. The 1:1 line is the primary indicator, but traders have choices for adding additional lines at their discretion. In both an uptrend and a downtrend, the 1:1 line can help to detect a reversal. In a downtrend, a price that stays below the 1:1 line is considered bearish. In an uptrend, a price that stays above the 1:1 line is considered bullish. Thus the 1:1 line can serve as a resistance and support line.
Additional lines drawn in a Gann fan diagram are also used as resistance and support lines. Gann believed that if the price moved through one angle, it would likely head to the next angle. For example, if the price dropped below the 45-degree angle (1:1), it would drop to the 26.25-degree angle (2:1).
A price that drops below 1:1 doesn’t necessarily mean the overall uptrend is over. The price may find support at 2:1 and then keep rising. That said, the fall below 1:1 could indicate at least short-term weakness if the price drops to the 2:1 line. The Gann fan can be used to help traders identify trend direction and potential areas of support and resistance.

Gann Fan Indicators and Oscillators
Here are various Gann fan indicators and oscillators that are technical analysis tools based on the work of W.D. Gann:
- Gann fan indicator: It is a technical indicator used to identify potential support and resistance levels on a price chart. The Gann fan indicator can be used along with other technical analysis tools to confirm potential support and resistance levels.
- Gann oscillator: This is a technical indicator based on the difference between two moving averages. The Gann oscillator is typically plotted on a separate window below the price chart and can be used to identify potential buy and sell signals.
- Gann HiLo Activator: It is an indicator developed by Robert Krausz, based on the work of W.D. Gann. The Gann HiLo Activator is plotted as two lines, one above and one below the candle, and it is used to identify potential support and resistance points.
- Gann Swing Chart: It is a visual representation of the security’s price action plotted using horizontal lines and diagonal lines. Gann Swing Chart is used to identify potential buy and sell signals and to confirm trends.
Gann Fan Vs. TrendLine
Gann fan and trendline are both technical analysis tools that can be used to identify trend direction and strength in the market. However, there are some key differences between them.
A Gann fan is a series of lines drawn at specific angles that move at a uniform rate of speed. The 45-degree line is the most important one and is used as a reference point for all other lines. Gann angles can help forecast where the price is going to be on a particular date in the future. However, they do not always predict the market accurately, but instead provide an idea of the trend direction and strength.
On the other hand, a trendline is created by connecting bottoms to bottoms or tops to tops, and it is matched to recent price action. Trendlines can also help identify trend direction and support/resistance levels. However, they require constant adjustments, making them less reliable for long-term forecasts.
Here’s a table summarizing the main differences between Gann fan and trendline:
| Gann fan | Trendline | |
|---|---|---|
| Movement | Diagonal line that moves at a uniform rate | Straight line connecting points |
| Purpose | Identify potential support and resistance | Identify potential support/resist |
| Predictive value | Indicates where Gann angle will be | Has some predictive value but unreliable for long-term forecasting |
| Accuracy | Can be accurate with proper use | Can be less accurate due to constant adjustments |
| Use with | Used in conjunction with other tools | Can be used alone or with other tools |
Gann Fan Trading Tips and Tricks
When using the Gann fan for trading, there are several important factors to consider:
- Identify the price trend of a security before plotting the Gann fan. This helps to determine the appropriate angle to use and to avoid inaccurate predictions.
- Use the Gann fan in conjunction with other technical analysis tools, such as trend lines and moving averages, to confirm potential support and resistance levels. This helps to reduce false signals and improve the accuracy of the analysis.
- Use multiple timeframes and indicators when making trading decisions. This provides a more comprehensive view of the market and helps to identify opportunities that may be missed by focusing on a single timeframe or indicator.
- Have a solid risk management plan in place. This helps to protect against potential losses and ensures that trading decisions are based on sound principles.
- Use the Gann fan in conjunction with other strategies, such as trend-following or breakout strategies. This helps to provide a more well-rounded approach to trading and can improve the overall effectiveness of the strategy.
- Backtest the strategy before applying it to the live market but note that past performance does not guarantee future results. Backtesting can help to identify potential issues with the strategy and refine it for better performance in the live market.
Limitations of Using the Gann Fan
In some charting platforms, the Gann fan may be available but the angle tool required to set the 45-degree line accurately may not be available. Scaling of different assets may also vary and may not be at a 1:1 ratio.
Upon application of the Gann fan on multiple charts, it may not always be useful as the price may not reach the marked levels or may continue to rise even when below the 1:1 line. This can result in the lines not marking significant support or resistance levels, making the indicator less effective.
Over time, the lines of the Gann fan continue to spread out, making the distance between the lines too large. This may render the indicator ineffective for trading purposes as the price would need to move a significant distance before reaching the next level or trading signal.
To optimize the effectiveness of the Gann fan, it should be used in combination with other technical indicators, price action, and other forms of analysis.
GannZilla
Gannzilla is a trading software that is designed to help traders incorporate the Gann analysis into their trading strategy. It provides a range of tools and features that make it easier to use Gann indicators, including the Gann fan, in a more effective and efficient manner.
One of the benefits of using Gannzilla is that it offers an angle tool, which allows traders to set the 45-degree line at a true 45-degree angle for each chart. This ensures that the Gann fan is accurate and can be used to identify potential support and resistance levels more effectively.