Gann Theory
Gann Theory is a concept crafted by William D. Gann in the early 1900s. A seasoned trader, he held the belief that stock prices exhibit a unique angle of change. These price movements, he observed, follow patterns reminiscent of natural geometric shapes. Gann’s remarkable insights led to the development of what’s now known as the “Gann Angle Theory.”
The enduring relevance of Gann’s trading strategy remains evident; when wielded with precision, it can accurately forecast an asset’s movement with a remarkable up to 90% accuracy. At the heart of Gann’s theory is the notion that financial markets adhere to a natural time cycle, guided by the principles of natural geometry and ancient mathematics.
In essence, Gann’s Theory asserts that by examining the patterns and angles formed by an asset’s behavior in the market, one can unlock valuable insights to predict its future price movements with notable reliability.
Gann Angles
Gann Angles are a unique set of techniques developed by W.D. Gann for analyzing price charts. Gann’s foundational belief was that each angle and pattern holds distinct characteristics that can be harnessed to predict price movements. An essential aspect of Gann’s charts is that they maintain a consistent time and price interval.
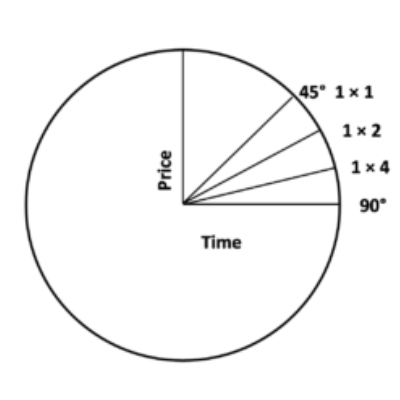
In the realm of Gann Angles, the price-to-run ratio of 1×1 always corresponds to a 45-degree angle. Gann emphasized that the optimal alignment for price and time occurs when they ascend or descend at a 45-degree angle in relation to each other.
To construct Gann Angles at varying angles, a substantial market high or low point is required. When prices reside above the trendline, it signals a bullish market; conversely, if they fall below, it indicates a bearish market. Gann believed that 1×1 trendlines serve as critical support and resistance levels in an uptrend, and a breach of this line signifies a significant trend reversal.
Gann identified nine key angles, with the 1×1 angle being the most significant:
- 1 x 8 – 82.5 degrees
- 1 x 4 – 75 degrees
- 1 x 3 – 71.25 degrees
- 1 x 2 – 63.75 degrees
- 1 x 1 – 45 degrees
- 2 x 1 – 26.25 degrees
- 3 x 1 – 18.75 degrees
- 4 x 1 – 15 degrees
- 8 x 1 – 7.5 degrees
These Gann Angles provide valuable insights for analyzing and predicting price movements in the financial markets.
Gann astutely recognized that each angle possesses the capability to define essential support and resistance thresholds, intricately linked to the prevailing trend. Among these, the 1×1 angle emerges as a paramount indicator, extending formidable support. Notably, a profound market signal manifests when prices commence their descent below the 1×1 angled trend line, heralding a substantial and noteworthy reversal in the prevailing trend. This underscores the pivotal role that Gann Angles, particularly the 1×1 angle, assumes in the realm of technical analysis, offering invaluable insights into the projection of market dynamics.
Understanding the Fundamentals of Gann Theory
Gaining a solid grasp of Gann Theory’s essentials is made straightforward by delving into the concept of Gann angles, particularly in the context of intraday trading. Let’s illustrate this with a straightforward example: In an upward-trending market, as long as the angle trend line remains unbroken, the market’s bullish trajectory persists.
Gann Theory serves as a valuable tool for traders aiming to secure profitable returns in the market. A plethora of Gann Theory resources, both online and offline, including books, can aid traders in their endeavors. These resources provide fundamental insights into the practical application of Gann Theory to enhance trading strategies.
Practical Application of Gann Theory
Gann Theory proves instrumental in the examination of patterns, combining both price and time considerations:
- Price Study: Leveraging Gann angles allows for the meticulous tracking of stock price dynamics. Pivot levels come into play to forecast future price shifts. Crucially, resistance and support levels come into play in determining a stock’s prospective price trajectory.
- Time Study: Gann’s time study model equips traders with insights into potential reversals in a stock’s value. This entails an in-depth analysis of historical data, aiding in the determination of the stock’s current valuation. Gann’s time study theory empowers traders to estimate potential declines in a stock’s price, necessitating a thorough examination of its price movements across varying timeframes.
- Pattern Study: The utilization of patterns proves invaluable in deciphering stock movements and discerning investor activity. Pattern analysis encompasses the identification of trends and patterns that serve as harbingers of potential reversals in stock behavior.
These facets of Gann Theory enhance traders’ capacity to discern market trends, predict price movements, and strategically position themselves for informed decision-making.
Utilizing the Gann Trading Strategy
Gann’s trading strategy, rooted in key assumptions, offers a structured approach to market analysis:
- Time Cycles: Gann believed that stock market movements adhere to discernible time cycles.
- Geometric Design: He posited that markets inherently possess geometric patterns governing their movements.
- Price, Time, and Range: Gann contended that market behavior is primarily influenced by price, time, and range considerations.
The “Rule of All Angles”: Market angles are consistent and can be viewed as immutable. An asset progresses from one angle to the next, following a rule known as the “Rule of All Angles.” Gann angles are frequently employed to pinpoint support and resistance levels.
- Breakout and Breakdown: When support is breached, it’s referred to as a “break,” signaling a forthcoming price drop. Conversely, a “breakout” occurs when resistance is overcome, indicating an upward price move.
Implementing Gann Angles: Traders designate their chosen time frame and then plot Gann angles on the stock chart. These angles include 1X1, 2X1, 3X1, 3X1, 1X2, 1X3, and so forth. These lines are tailored to the trader’s needs and serve as tools for interpreting price movements.
Support and Resistance: Uptrending support angles signify support, while downtrending angles denote resistance. Occasionally, traders blend horizontal and angled lines to pinpoint support or resistance. For instance, in a bullish scenario, a retracement to the 50% level acts as support. Conversely, in a bearish context, the 50% retracement level becomes a pivotal resistance point. These angles, often referred to as price clusters, are pivotal in understanding the support and resistance dynamics for assets with multifaceted trading angles.
FAQs
Drawing Gann Angles at Different Inclinations: To create Gann Angles at varying angles, it’s imperative to identify significant market highs or lows. When prices are above the trendline, it signifies a bullish market, while being below it indicates a bearish trend. Gann notably emphasized that 1×1 trend lines act as crucial support and resistance levels in an uptrend. A breach of this line serves as a significant signal, hinting at a substantial trend reversal.
Pattern Study in Gann Theory Application: Utilizing patterns aids in identifying stock movements and gauging investor activity. Pattern study delves into recognizing trends and patterns that foreshadow potential reversals in stock behavior.
Key Tenets of Gann Theory: Gann Theory posits that an asset’s patterns and angles in the market can be utilized as predictive tools for forecasting its future price movements.
Conclusion:
Gann Theory serves as a vital technical analysis tool embraced by traders. Nine special numbers play a pivotal role in setting stop loss and target levels based on the last traded price (LTP). These targets, which can be bullish or bearish, are calculable via various websites. However, it falls upon the trader to select the most suitable targets. When applied correctly, Gann trading strategies, leveraging Gann indicators, can yield numerous successful trades. However, success hinges on accurate application, which demands both time and experience. Gann Theory empowers traders to analyze markets and anticipate future stock price movements, yet prudence dictates backtesting strategies and implementing stop-loss measures in every trade.