W.D. Gann (1878-1955) stands as a remarkable figure in technical analysis. Born on a cotton ranch in Lufkin, Texas, on June 6, 1878, W.D. Gann boasted exceptional skills in mathematics from a young age. Despite starting with a trading approach driven by “hope, fear, and greed,” which proved unfruitful, Gann’s journey eventually led him to recognize that markets adhered to mathematical laws and distinct time cycles.
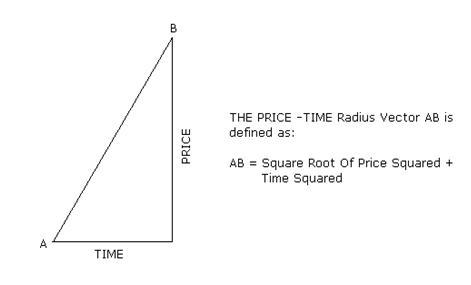
Intrigued by the relationship between price and time, which he referred to as the “square” of price and time, Gann embarked on a tireless quest for understanding. His dedication extended to global travels, including visits to England, India, and Egypt, to delve into mathematical theory and historical price data.
Gann’s work epitomized diligence, with thousands of charts spanning daily, weekly, monthly, and yearly prices across various stocks and commodities. His research even ventured back centuries. In an era dominated by fundamental analysis, Gann’s groundbreaking theories hinged on mathematical principles, time cycles, and his unwavering belief that past market behavior foretold future movements.
W.D. Gann’s Law of Vibration
Within his Stock Market Courses, W.D. Gann introduced the concept of the “Law of Vibration.” He asserted that all stocks and commodities undergo vibrations. This law posits that by calculating the rate of vibration, it becomes possible to forecast the future price movements of an asset. Notably, the Gann Angle Theory is rooted in this fundamental concept.
Gann Price vs. Time Square & Gann Angle
Among Gann’s significant discoveries, the squaring of price and time emerges as one of the most pivotal. In his trading course, he emphasized that adhering to the rule of observing instances when price aligns with time or when time and price coincide allows for more accurate forecasts of significant trend changes. This principle underscores the profound interplay between price and time in market analysis.
Squaring Price with Time:
This entails achieving a balance between an equal number of points moving up and down, aligned with an equivalent number of time periods, be it days, weeks, or months. Gann recommended squaring not only the range but also low and high prices.
The Intersection of Price and Time:
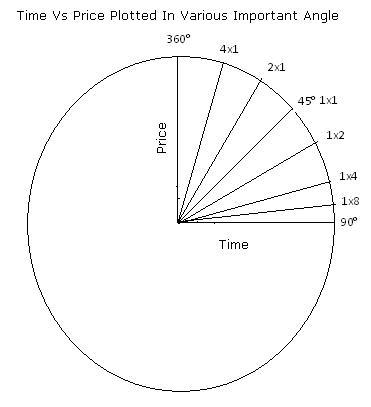
Gann meticulously charted the relationship between price and time. He expressly conveyed that at the juncture where the price and time trend lines intersect, a compelling rationale exists for anticipating a change in trend. Gann delineated 11 distinct trend lines, each serving as a guiding tool for traders to make well-timed decisions. These trend lines are constructed based on geometric angle proportions within the X and Y axes, enabling traders to navigate the market with greater precision.
The Significance of Gann Angles
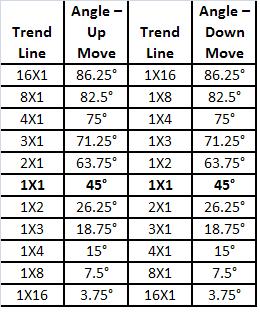
The paramount Gann angle is the 1X1 angle, pronounced as “one by one.” This straight line, when drawn on a price-time chart, forms a 45° angle with the X-Axis. In essence, it represents a trend line constructed under the premise of a 1-unit price change corresponding to a 1-unit time change, particularly in a semi-logarithmic scale.
Similarly, the 2X1 (read as “two by one”) trend line implies a scenario where a 2-unit price movement occurs in just 1 unit of time. When initiated from a lower price point and extended towards higher prices, this trend line assumes a geometric angle of 63.75° with respect to the X-Axis. Conversely, when drawn from a higher price point towards lower prices, it exhibits a 26.25° angle concerning the X-Axis.
These Gann angles serve as invaluable tools for traders, allowing for precise analysis and decision-making in the market.
Gann Wheel: Unlocking Market Insights
W.D. Gann was unwavering in his emphasis on traders adhering to specific rules, particularly in the context of identifying crucial moments when price and time align. He contended that by recognizing when the price squares with time or when they converge, traders could astonishingly forecast major trend shifts. This is particularly potent when leveraging tools like the Gann wheel or the Square of Nine.
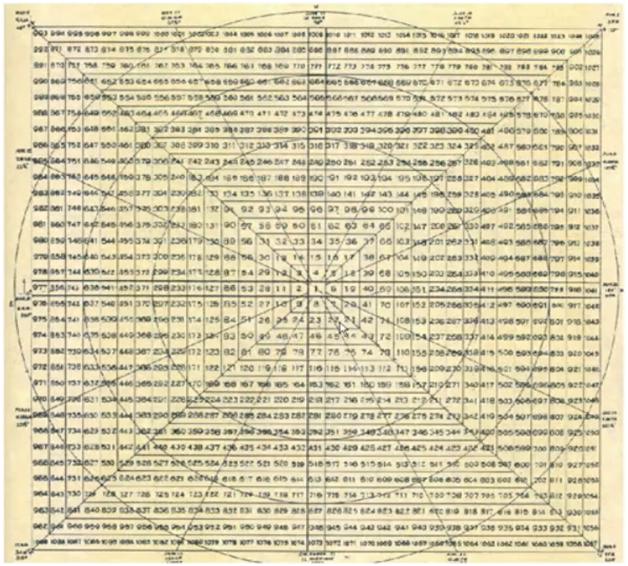
The Gann wheel, often referred to as the Square of Nine or a Square Root calculator, forms the crux of this methodology. As depicted, it comprises concentric rings with the number 1 at its center. Visualizing a complete circle is essential to comprehend the relationships; for instance, the number 19 is precisely 90 degrees away from 15, while 8 is positioned 180 degrees opposite 46.
W.D. Gann had a profound insight that delved into the mathematics involved. He illustrated that by adding 2 to the square root of a number and then squaring the result, it corresponds to a full 360-degree rotation on the Gann wheel. Hence, 2 symbolizes a 360-degree shift, with 1 representing a 180-degree rotation and 0.5 signifying a 90-degree turn. Gann attributed significance to 90-degree movements in the markets, suggesting that adding or subtracting 0.5 or its multiples to the square root of a stock price before squaring held meaning. Interestingly, 90 degrees holds importance in astrology, potentially influencing Gann’s insights.
What sets the Square of Nine apart is its complete indifference to whether variables involve price ranges, individual prices, or stock trading days. In the realm of the Square of Nine, these variables are interchangeable and equally influential. For traders accustomed to charts, moving averages, and oscillators, the transition to concepts like squares, circles, and square roots might appear daunting and even mystical, but they form a key part of Gann’s unique approach to market analysis.