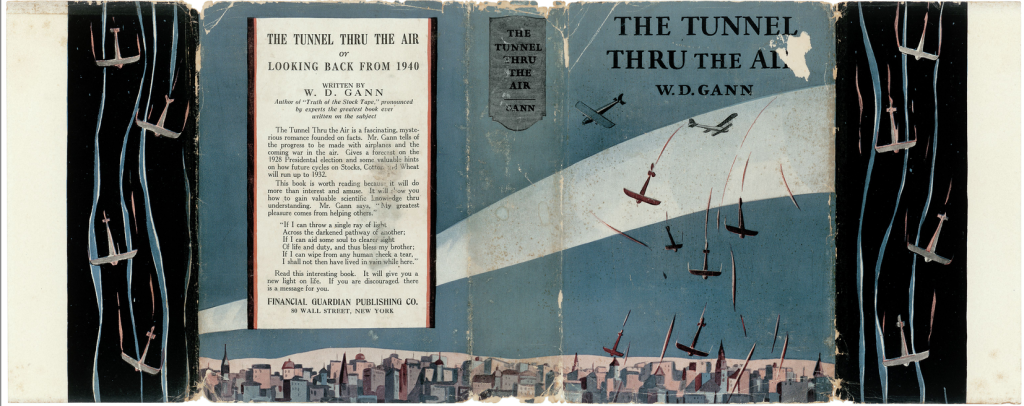
Whether you’re a seasoned technical analysis practitioner or a trader, you’ve likely come across the name W.D. Gann and his trading theory. But who was Gann and why is he still sought after even 60 years after his death? Let’s take a closer look.
William Delbert Gann, also known as WD Gann, was born on June 6, 1878, and began his trading career as a finance trader in 1902 at the age of 24. Gann developed a range of technical analysis tools, including the WD Gann Angles, Circle of 360, Square of 9, Hexagon, and others. Many of his theories were based on astronomy, geometry, astrology, and ancient mathematics, and are still widely used by traders today. Gann’s intraday trading theory is considered one of the most successful methods for day traders.
Revolutionize your trading game with Gannzilla – the powerful technical analysis tool based on W.D. Gann’s theory. Analyze the market like never before and make informed trading decisions with ease.
Rules of significance in WD Gann’s trading theory
- If the high price for the entire week is achieved on Friday, expect higher prices next week.
- If the low price for the entire week is achieved on Friday, expect a much lower price next week.
- In a highly uptrending market, the weekly low is achieved on Tuesday.
- If the market is in a strong downtrend, the weekly highs are generally achieved on Wednesday.
- When the price crosses the high of the last four weeks, it’s an advance indication of more higher prices.
- When the price breaches the low of the last four weeks, it’s an advance indication of more lower prices.
- In an uptrending market, if the prices break the 30 DMA and remain below it for at least 2 consecutive days, it tells us of a much greater correction (vice-versa).
- If the market rises for 5 consecutive days, there is a high probability that correction will be lasting for 3 days. (Ratio is 5:3).
- When the price starts rising from a particular level, Rs.100 or 100% rise, whichever is earlier, becomes a strong resistance.
- When price crosses the high of the last 3 days, it tells us about much higher prices on the 4th day.
- If subsequent correction is greater than the previous correction both in terms of price and time magnitude, this is an advance indication that the trend is changing.
- 50% of the last highest selling price is the strong support area. Any stock which is trading below this 50% level is not that useful for investment.
- If a price is rising for 9 consecutive days at a stretch, then there is a high probability of a correction for 5 consecutive days. (Ratio is 9:5)
- Don’t ignore a Double Bottom and Triple Bottom signal on a monthly chart after a minimum gap of 6 months. (Advance indication for mid-term investment)
- Don’t ignore a Double Top and Triple Top signal on a monthly chart after a minimum gap of 6 months. (Not the right place for investment/entry, the price may fall).
- When the price is in a choppy phase or in a consolidation phase, if a sudden volume spike is found there, it’s an advance indication that the trend is likely to change.
- In a quarterly time frame, when a particular stock crosses the high or low of the last quarter (in the quarterly chart), it should be considered as an early indication that the underlying trend is trying to reverse.
- Follow the trend and avoid trying to predict the market.
- Always use stop losses and position sizing to limit your risks.

Principals of gann trading
- Time cycles: Gann believed that markets move in predictable time cycles, and by understanding these cycles, traders can predict future price movements.
- Price movements: Gann believed that prices are the most important factor in determining market movements. Traders should focus on the price movements of a market, rather than external factors.
- Support and resistance: Gann’s theory relies heavily on the concept of support and resistance levels. These levels are determined by previous price movements and can be used to predict future price movements.
- Trend analysis: Gann’s theory emphasizes the importance of trend analysis. Traders should analyze the trend of a market and look for signs of a reversal.
- Geometry: Gann believed that markets are geometric in nature and that price movements can be predicted by analyzing geometric patterns.
- Angles: Gann’s theory uses angles to determine support and resistance levels. These angles can be drawn at different degrees and used to predict price movements.
- Patterns: Gann’s theory also focuses on patterns in price movements. These patterns can be used to predict future price movements.
- Time frames: Gann’s theory uses multiple time frames to analyze market movements. Traders should look at both short-term and long-term price movements to determine the overall trend of a market.
- Stop-loss orders: Gann’s theory emphasizes the importance of using stop-loss orders to limit losses in a trade.
- Backtesting: Gann’s theory suggests that traders should backtest their strategies before implementing them in a live trading environment.
It is crucial to follow the WD Gann trading rules to ensure successful trades and avoid costly mistakes. Gannzilla is a powerful tool that can help you implement these rules in your trading strategy. By using Gannzilla in combination with your knowledge of Gann’s principles, you can increase your chances of success in the stock, commodity, and currency markets. Remember that while the rules are essential, a proper trading strategy is also crucial for achieving profitable results.