Example 1:
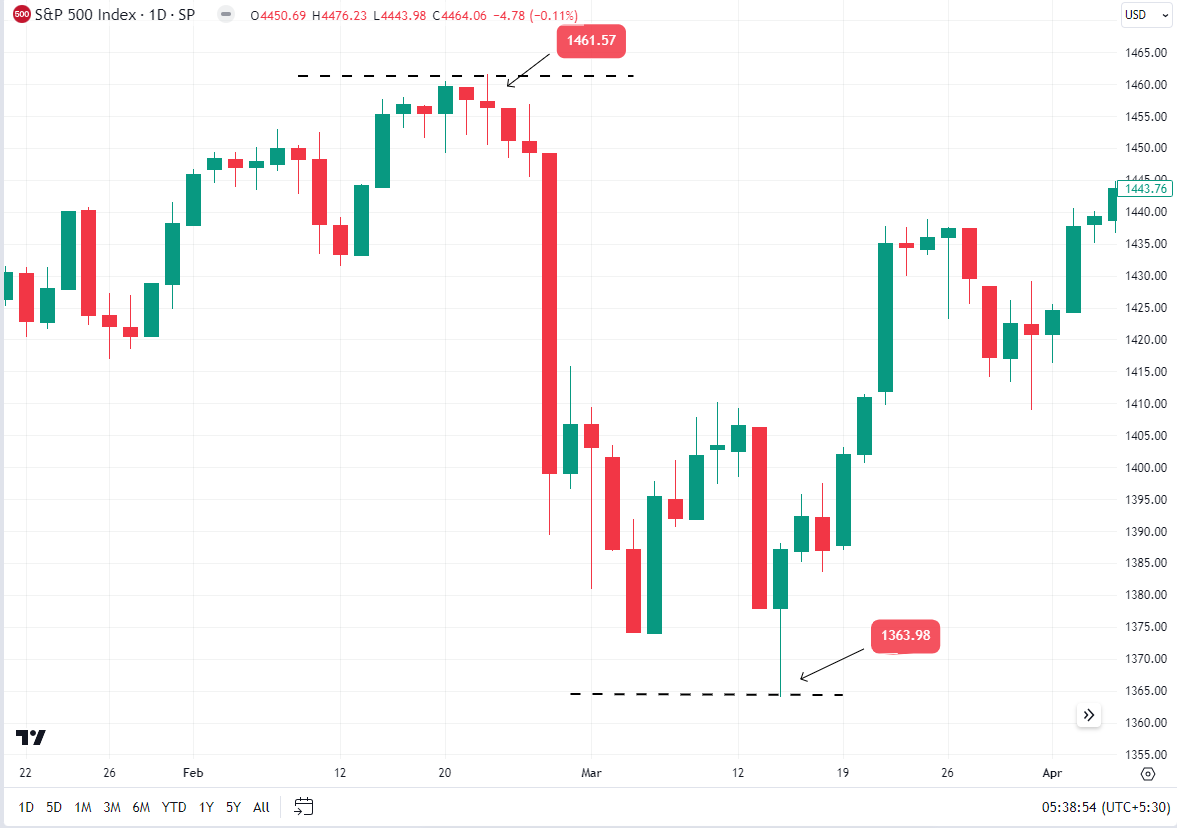
We will explain first the February 2007 High for S&P 500. That month the indicator had a High of 1.460 points. Let’s identify this value on Gann’s Square of Nine. The next month S&P 500 had a Low of 1.360.
We will look for this value in the square also.
This is the index’s chart:
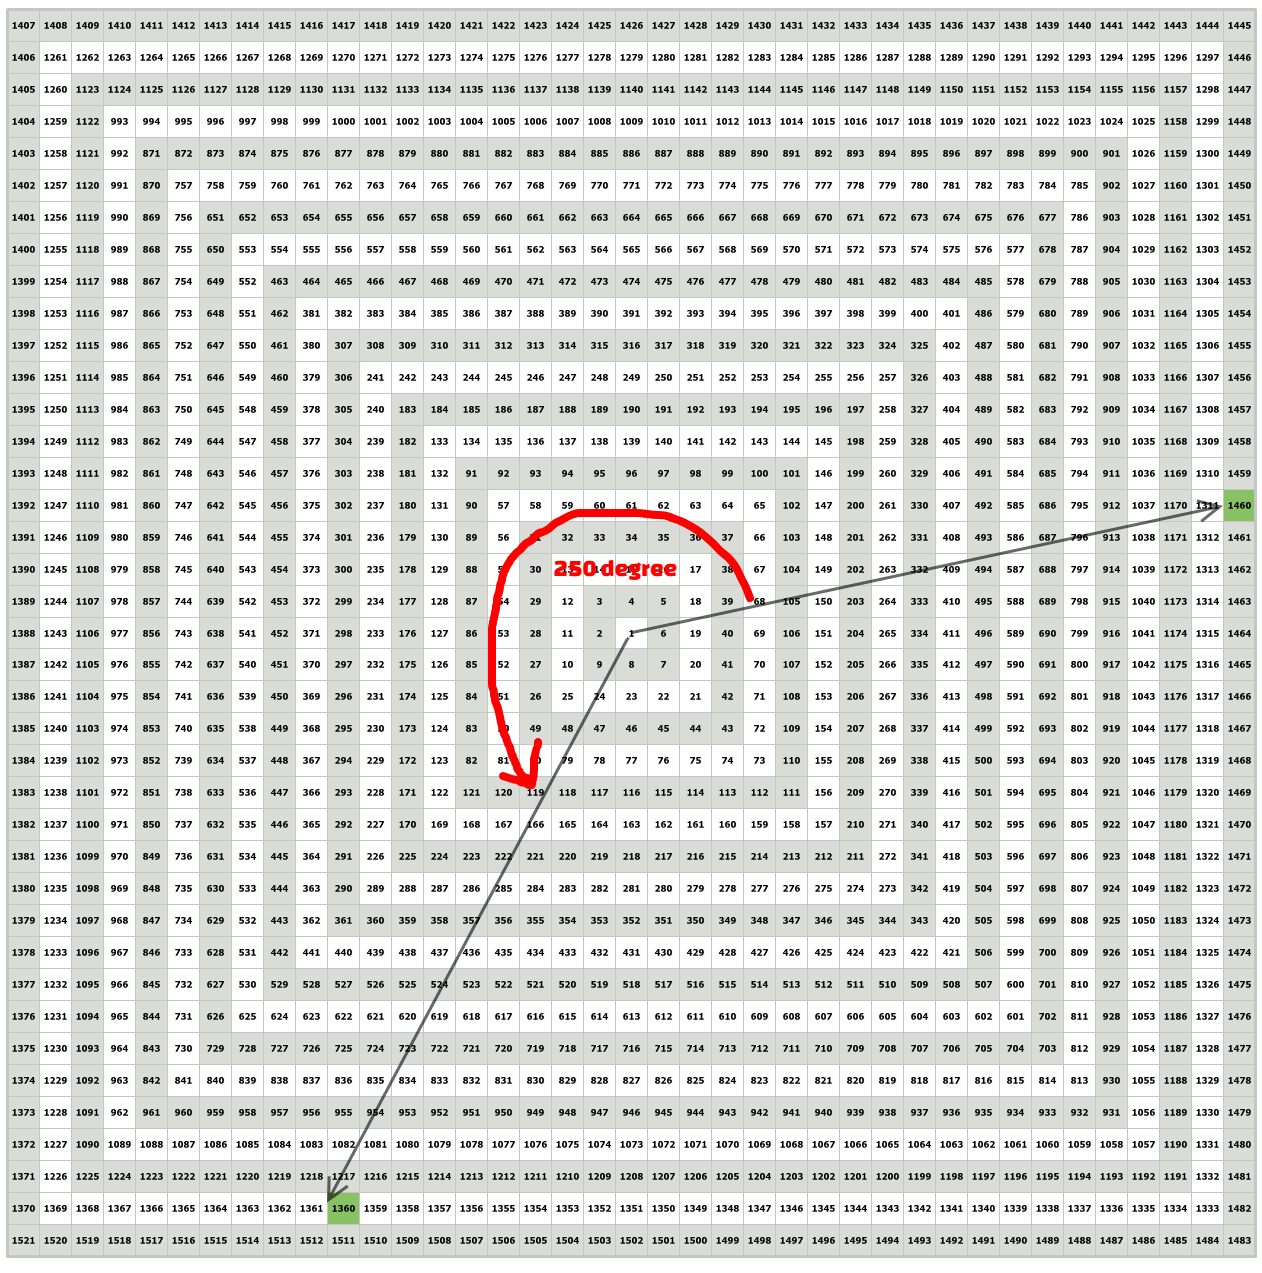
We can see below the two values on Gann’s Square of Nine. Between the center of the square and these points there is an angle forming. This angle is about 250 degrees.
This is Gann’s mathematical equation:
Square root of High – 1.4 = Square root of Low
Why 1.4? In trigonometry 360 degrees is defined as 2; 180 degrees as 1; 90 degrees as 0.5; and 250 degrees as 1.4.
In conclusion we have:
Square root of 1.460 – 1.4 = Square root of 1.360 (correct!)
Let’s see now why the indicator has fallen 250 degrees.
During the period of time, we are referring to, on the sky we had two major astrological aspects:
- Saturn opposition Neptune (This means 180 degrees)
- Sun square Pluto (This means 90 degrees)
If we add them: 180 + 90 = 270 degrees. This value is very close to the actual fall of the index.
The forecast would have been as it follows:
When analyzing the market at the end of February, after the 1.460 High, we would have looked at the astrological aspects coming the next month. These are the opposition and square presented above.
The sum of the aspects was 270 degrees. Using Gann’s Square of Nine and the mathematical equation:
Square root of 1.460 – 1.5 = square root of the value of next month’s Low
The result is 1.350.
So, the forecast would have said that the S&P 500 would have fallen to the value of 1.350 – 1.360 and then rise.
Example 2:
The second example is about the abrupt fall in the summer of 2007, more exactly, in August. We present the steps of the forecast:
Step 1: S&P 500 has a High of 1.550
Step 2: For the months of July and August 2007 we have the following astrological aspects:
- Mars square Neptune.
- Mars square Saturn.
- Saturn trine Pluto.
- Sun opposition Neptune.
All these aspects have a negative influence. We are expecting a declining in the evolution of the index with 90 + 90 + 120 + 180 = 480 degrees utmost.
Step 3: 480 degrees means 2.6 in trigonometry
Step 4: we apply the equation:
Square root of 1.550 – 2.6 = square root of the value of next month’s Low
Step 5: Next month’s Low is 1.355
Step 6: We would predict that in august S&P 500 will fall from a High of 1.550 to a Low of 1.355 -1.365
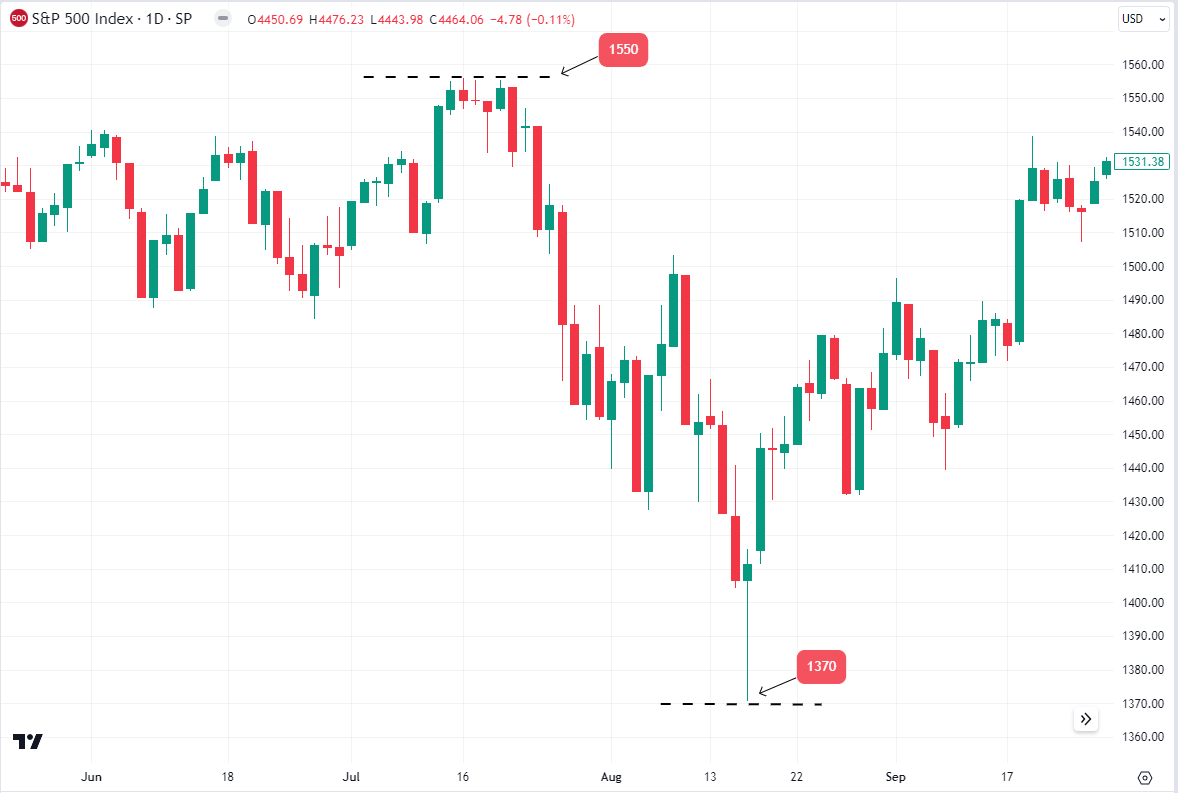
The facts were that S&P 500 had a Low of 1.370 and then started rising. Nice, isn’t it?

Example 3:
This is the last conclusive example:
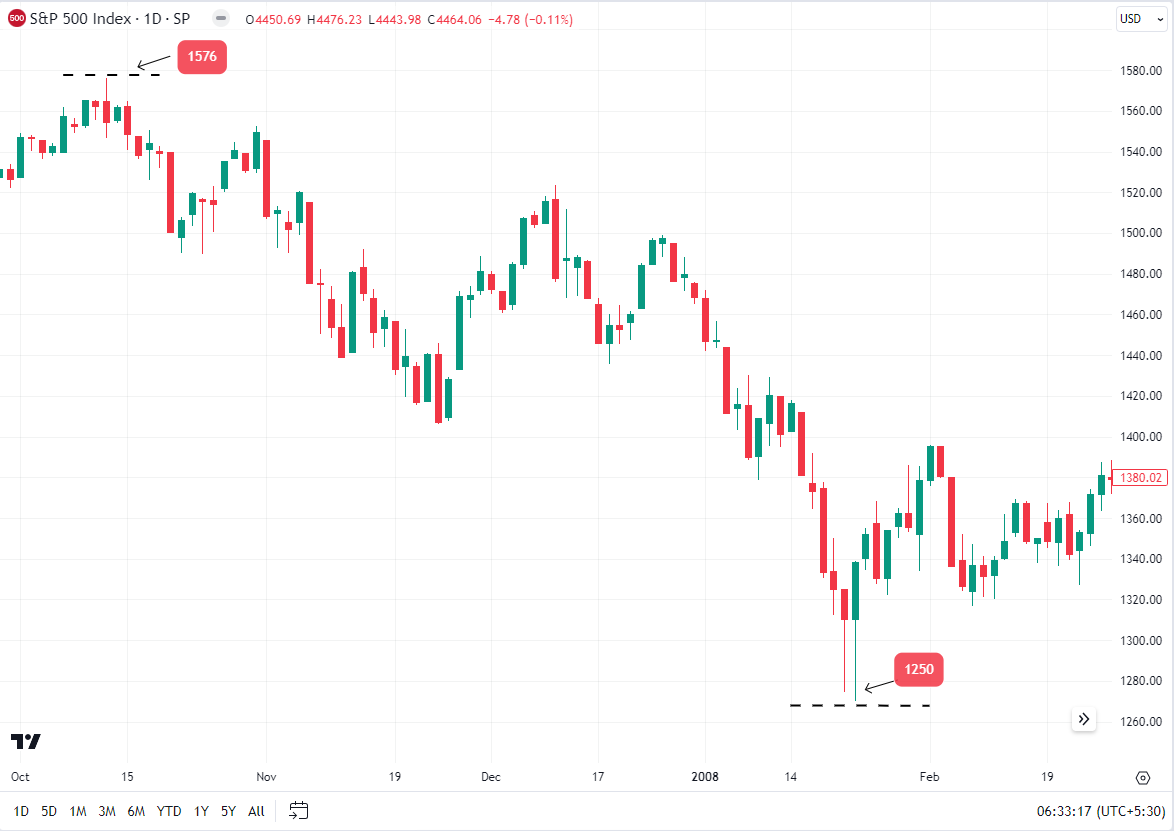
This example presents the forecast for S&P 500 which had a historic High in October 2007 and a decline in January 2008.
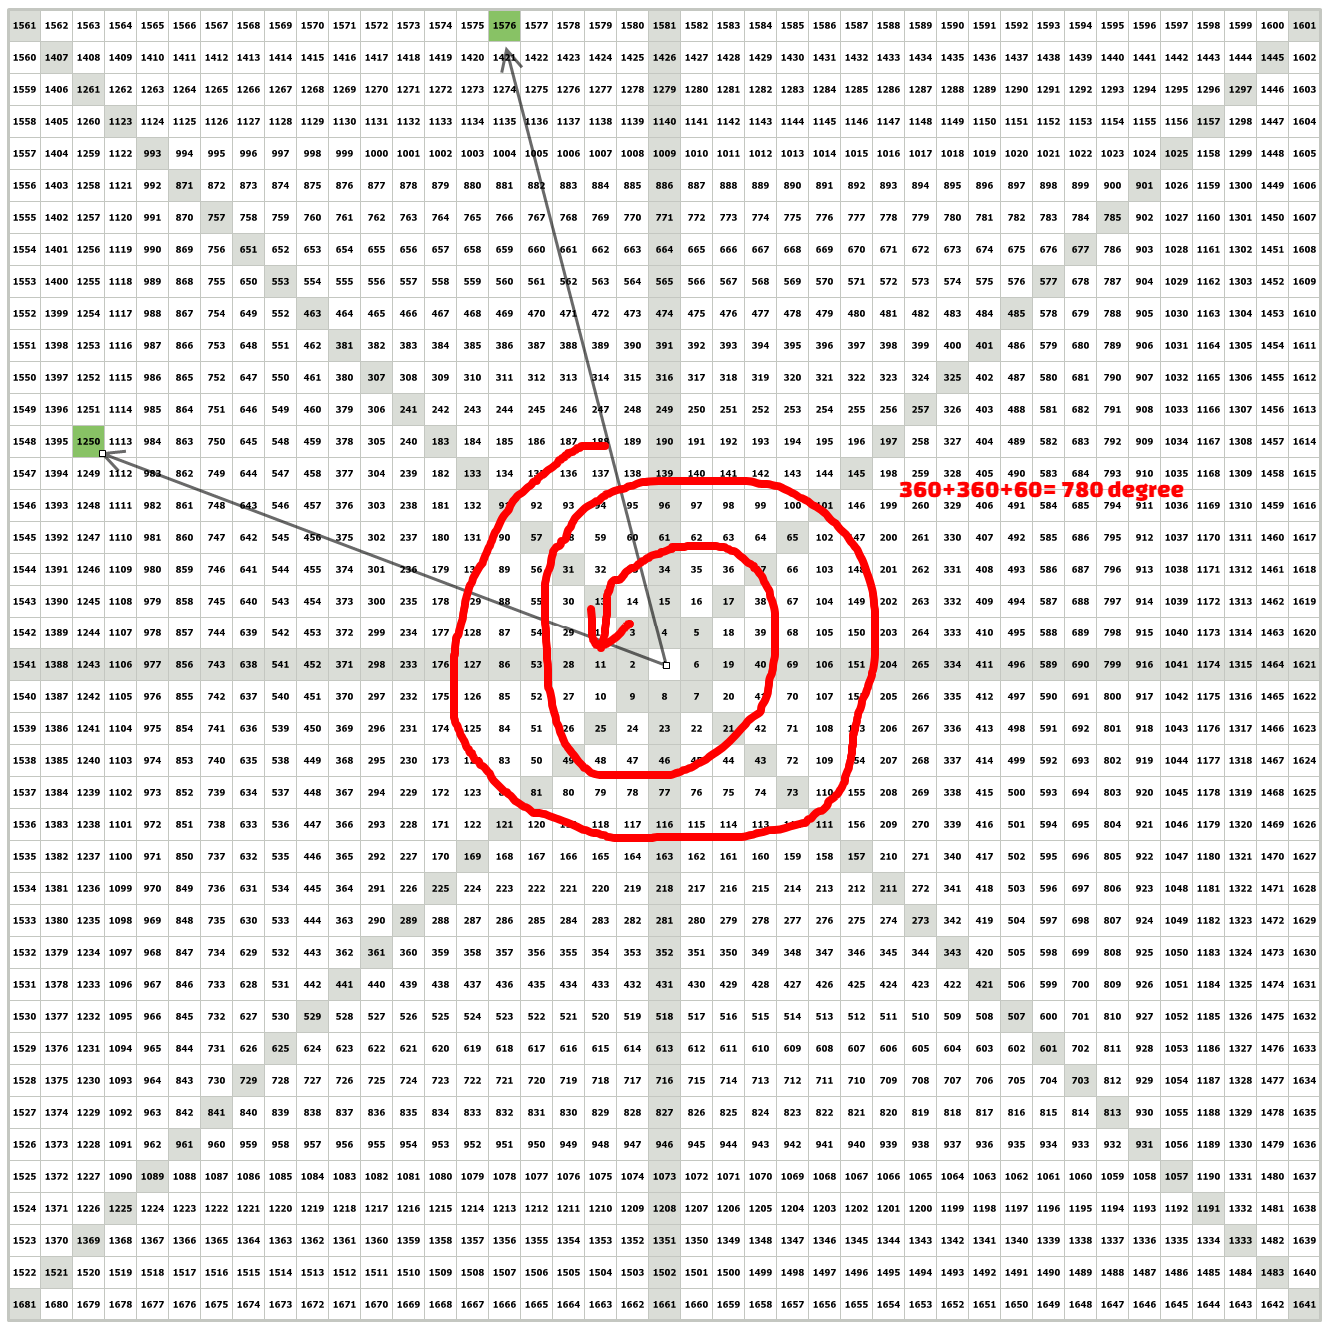
Step 1: The historic high is 1.576
Step 2: in the period October 2007 – January 2008 we have the following astrological aspects: Saturn opposition North Pole, Sun square Uranus, Sun square North Pole, Sun square Saturn, Sun square Uranus, Sun opposition Mars, Saturn trine Mercury. All these aspects are negative. We will expect a fall with 180 + 90 + 90 + 90 + 90 + 180 + 120 = 840 degrees.
Step 3: 780 degrees is 4.6
Step 4: We apply the equation:
Square root of 1.576 – 4.6 = Square root of the Low’s value
Step 5: The Low equals 1.260
Step 6: the conclusion is: S&P 500 will fall after the historic High to a 1.260 Low in January 2008
The facts were that S&P 500 had a Low of 1.250 and then started rising. Is there a coincidence or is it harmony?
Conclusions:
- This method of prediction is incredible exact and has a special harmony in it. It offers us correct ways of assessing future Lows and Highs for financial market’s indicators.
- Although it seems a complex and hard to handle method, it is a useful tool in our system of analysis. We have come to these conclusions after long years of thorough research. There are a lot of details to consider until a full understanding of the phenomenon but it can be done. We have understood Gann’s method. We give you simple and easy to apply analysis, but these analyses are the result of hard and meticulous work.