According to Gann, every angle and pattern on a price chart has unique characteristics that can be used to predict price action. His charts use the same time and price interval, making them highly precise and reliable. One of the key principles of Gann Angles is that a price/run of 1×1 will always equal a 45-degree angle. Gann believed that price and time are at their most powerful when they move in harmony at a 45-degree angle relative to each other.
To draw Gann Angles at different angles, you need to identify a significant top or bottom on the chart. If prices are above the trendline, it is a bullish market, while a bear market is indicated if they are below it. Gann believed that 1×1 trend lines provide major support and resistance in an uptrend, and that when the trendline is broken, it signals a major reversal of the trend.
1×1 Angle
The perfect harmony of time and price lies at 45 degrees
Gann believed that the ideal balance between time and price exists when prices rise or fall at a 45-degree angle relative to the time axis.
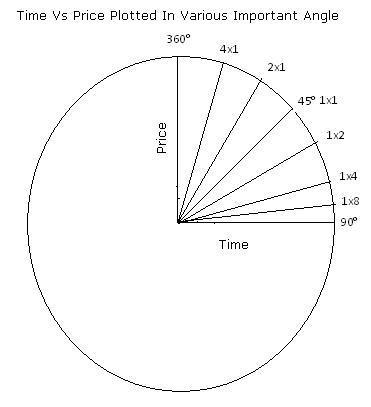
This is also called a 1 x 1 angle (i.e. prices rise one price unit for each time unit). Gann identified nine angles in total, with the most important being the 1×1 angle (read as one by one).
The other angles include –
- 1 x 8 – 82.5 degrees
- 1 x 4 – 75 degrees
- 1 x 3 – 71.25 degrees
- 1 x 2 – 63.75 degrees
- 1 x 1 – 45 degrees
- 2 x 1 – 26.25 degrees
- 3 x 1 – 18.75 degrees
- 4 x 1 – 15 degrees
- 8 x 1 – 7.5 degrees
Gann noted that all angles provide support and resistance levels based on the trend, with the 1×1 angle providing the strongest support. When the price begins to fall below the 1×1 angled trend line, it is a major signal of a trend reversal, indicating that traders should consider taking profits or reversing their positions. Understanding Gann Angles can be a powerful tool for traders looking to anticipate market movements and make informed trading decisions.
Gann Angles work like Support and Resistance
Gann believed that this is the most important angle and it determines trend strength i.e., it signifies a bull market if prices are above the angle or a bear market if below.
Each of the angles provides support and resistance depending on the trend.
- During an up-trend, the 1 x 1 angle tends to provide major support.
- A major reversal is signaled when prices fall below the 1 x 1 angled trendline.
Crosses & Gann Angles
In other words,
As one angle is penetrated, expect prices to move and consolidate and march ahead towards the next angle.
With each 45-degree rotation in the Gann Square of 9, You encounter either a cardinal cross or an ordinal cross. The numbers in Cardinal Cross and Ordinal Cross (or, call them Cardinal Numbers and Ordinal Numbers) are important pivot points.
With Each 45-degree rotation in the Gann Square of 9, You will encounter Pivot Points.
x-Axis, y-Axis
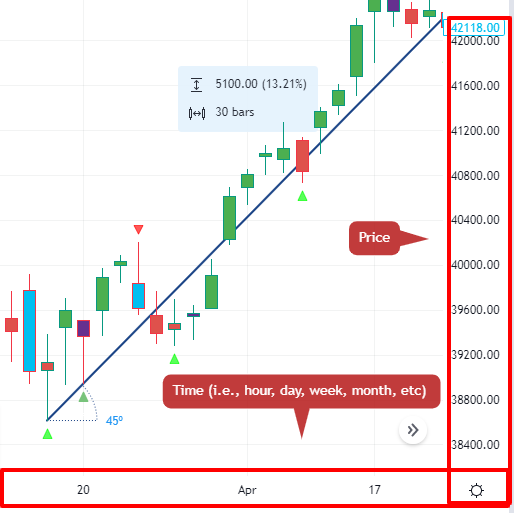
Before We discuss on the scale, it is important to revisit an important concept! What does the x axis and y axis signify in our traditional charting platform?
- x-axis marks the “Time (i.e., hour, day, week, month, etc.)”
- y-axis marks the “Price (or, any other variable)”
Rise/Run
- Rise/Run is a quick verbal term.
- In an 1×1 angle, the rise and run is equal.
- It corresponds to a 45-degree angle.
- The 1 x 1 in 1 x 1 angle means Price has moved by 1 unit and Time has moved by 1 unit. It represents a price movement of 1 price unit per day (trading day).
So, a 45-degree angle represents a 1:1 slope, where the price changes equally with time.