Although the main concept may seem apparent at first glance, the significant variations and complexities involved can be overwhelming and perplexing to the mind.
When we zoom in or out on a chart, it changes the scale of the chart.
- So, what is the correct scale?
- How to calibrate to the correct scale?
Scaling a Chart
Gann insisted on using scaled charts, because he was using his compass to draw vectors from highs to lows and vice versa.
Another reason for which he wanted them properly scaled, was that he laid overlays which had the paths of the planets. One instance he used all of these techniques was the famous Wheat 1909 call he made.
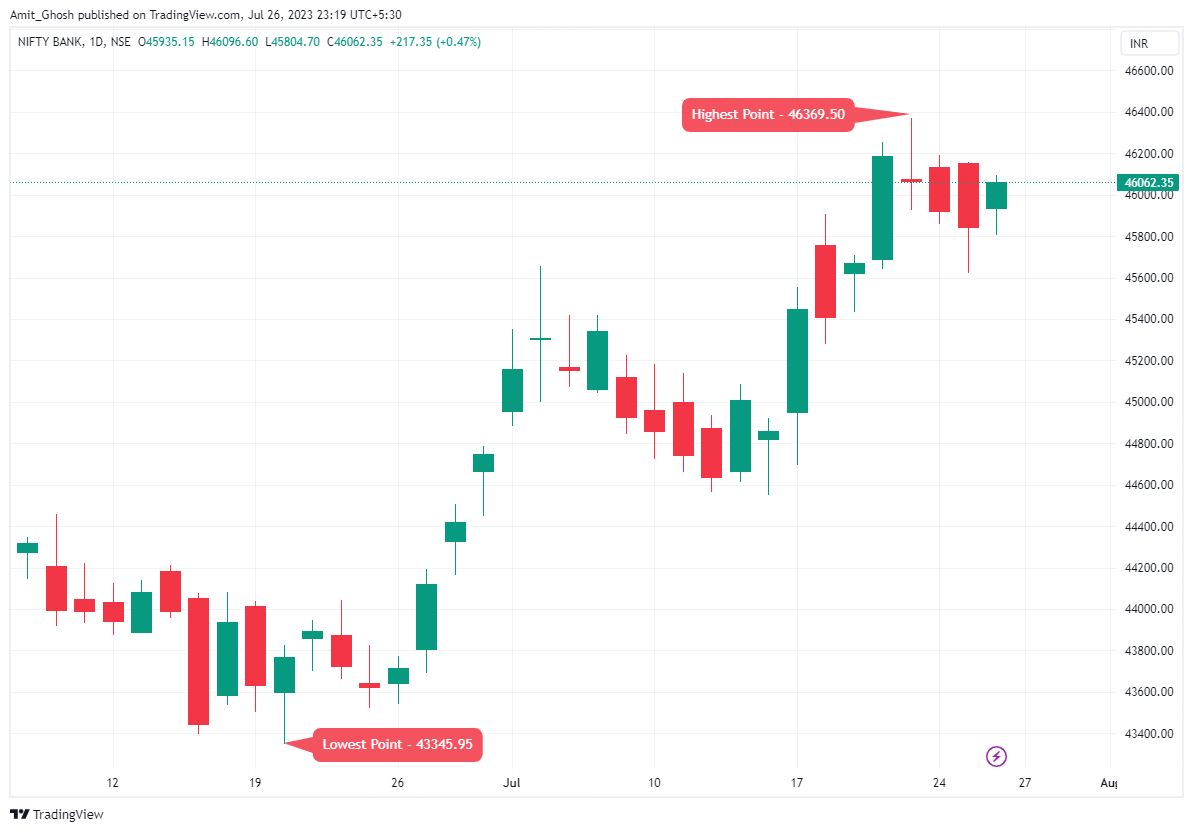
In this example, we are using the chart of Bank NIFTY in a Daily timeframe.
You can easily tell from the naked eye that it is in an uptrend.
- Let’s mark the Lowest Point i.e., Bottom of the trend.
- Similarly, Lets mark the Highest Point i.e., Top of the trend.
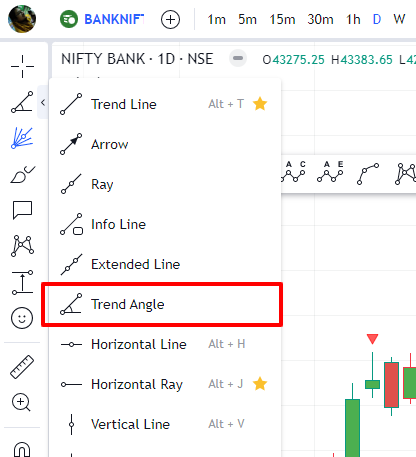
Date and Price Range
Now we will aim for the tool named “Date and Price Range”. As the name suggests, it is combination of two beautiful tools –
- Price Range – This tool allows user to place points vertically on two different prices.
- Date Range – This tool allows user to place points horizontally on two different time points.
Once the tool is selected, click on the Lowest Point i.e. Bottom of the trend and then click on the Highest Point i.e. Top of the trend.
A shaded box will then appear between the chosen points showing the date and time range.
Double Click on it to open the settings options of the Tool.
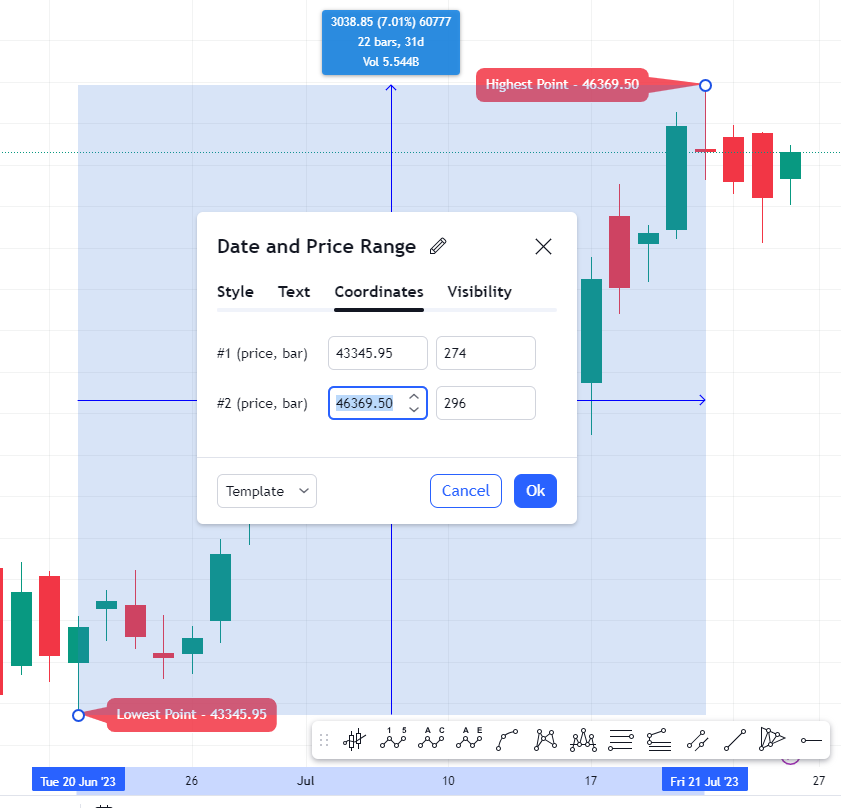
Make sure the price and bar in #1 and #2 is referring the correct price and location of the candles.
The Price Range
= 46369.50-43345.95
= 3023.55.
The Bar (Trading Days) Range
= 296-274
= 22.
So, on every single trading day, the average movement is
= 3023.55/22
= 137.434091
Recapping theory of Gann Angles –
- Gann believed that the ideal balance between time and price exists when prices rise or fall at a 45-degree angle relative to the time axis.
- This is also called a 1 x 1 angle (i.e., prices rise one price unit for each time unit).
The Ideal Price to Bar Ratio
So, the ideal Gann Scaling Parameter will be achieved if the Trend Angle drawn between the Lowest Point and Highest Point is 45 degrees.
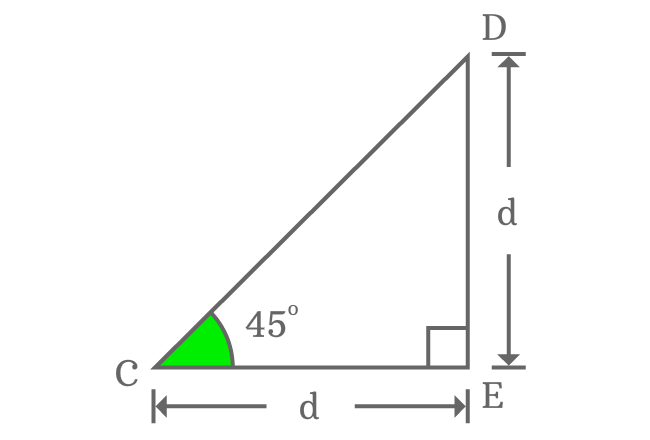
For that, we need to revisit the property of an isosceles right triangle.
The 45°-45°-90° right triangle is called isosceles right triangle because it has two equal side lengths and two equal angles.
- The Price has moved 3023.55 points in 22 Bars.
- So, the ideal Gann Scaling Parameter will be achieved if Price to Bar ratio is (3023.55/22) = 137.434091.
- In that case, the distance in the chart covered by Dates will be same to the distance covered by the Price.
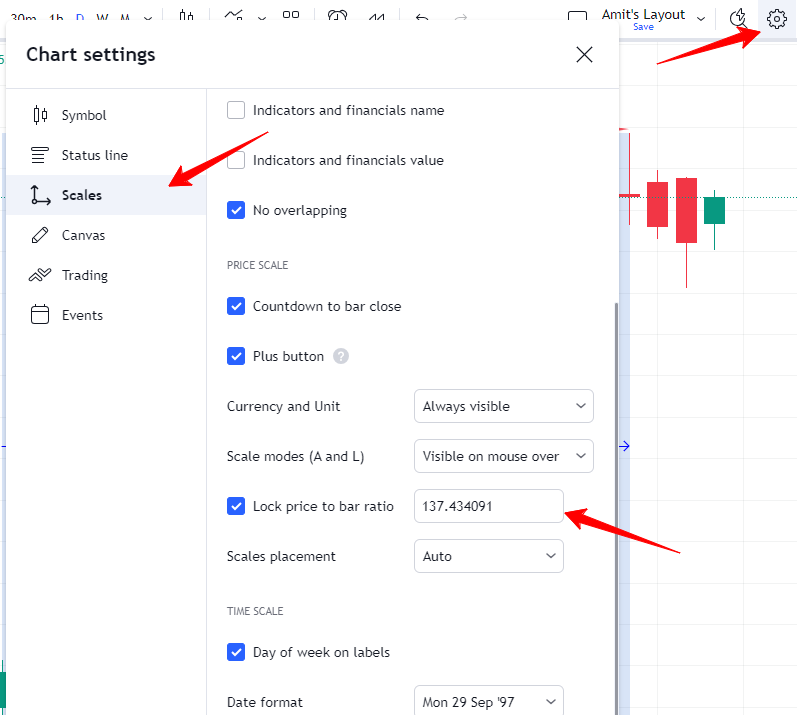
Let’s set that!
- Click on Settings
- Click on Scales
- Check Lock price to bar ratio in the figure of 137.434091
Verify with Trend Angle Indicator
Now Let’s verify the Trend Angle which represents the angle at which the price is moving on a chart.
It should reflect 45 degrees.
For a better visualization, Let’s remove the Date and Price Range tool.
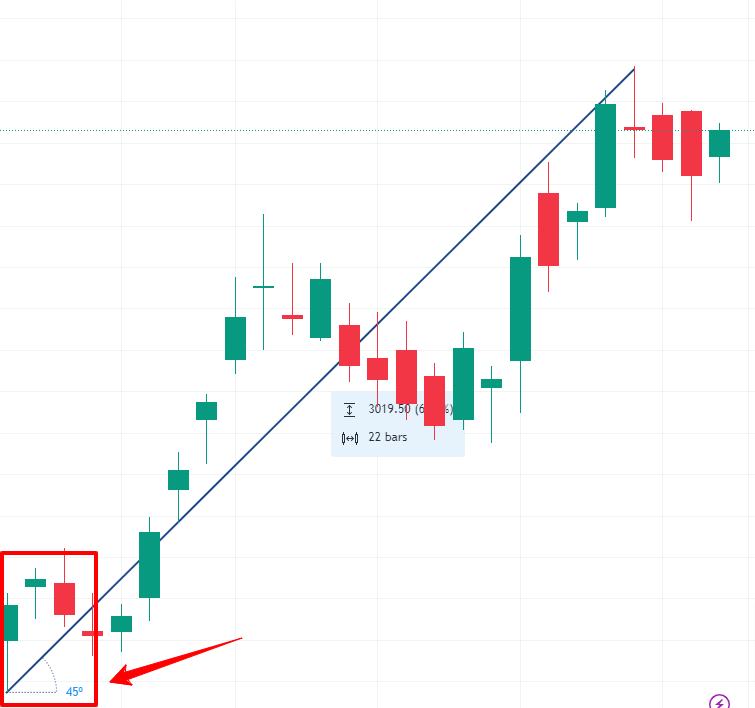
And it shows – 45 Degree Angle.
This chart is hence, Gann Scaled!