Equal Spacing
However, for these angle measurements to accurately represent the actual slope of the trend, it’s important to ensure that the chart is properly calibrated or scaled.
According to Gann’s methodology, calibrating the chart involves ensuring that the intervals on both the x-axis and y-axis maintain uniform spacing.
By maintaining equal spacing between intervals on both axes, the chart preserves the proportional relationship between price changes and time.
Gann Scaling
This ensures that the rise (vertical distance) and run (horizontal distance) measurements accurately represent the angles formed by the trend.
The easiest way to calibrate the chart is make sure that a 1 x 1 angle produces a 45-degree angle.
Gann Trendlines
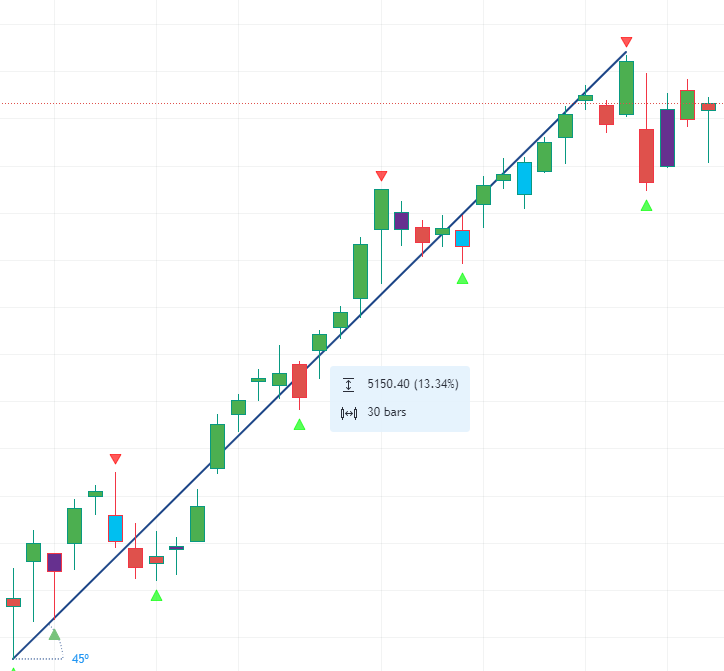
- Here, 1×1 Trend line is line drawn assuming 1 unit of price change with respect to 1 unit of time change.
- Similarly, 2X1 (two by one) trend line means line is drawn assuming the 2 unit of price rise or fall happens in 1 unit of time.