Let’s take a fascinating journey back in time to September 1909, when the legendary trader Gann made a daring prediction about the wheat market. Fast forward a whole century, and we’re here to dissect and understand the brilliance of his call. It’s like peering through a time machine into the mind of a financial sage!
Gann’s intriguing approach to scaled charts was driven by his use of a compass to sketch vectors connecting market highs and lows in both directions. Moreover, his precision in chart scaling was attributed to his practice of overlaying planetary paths onto these charts, revealing another layer of his strategic thinking.
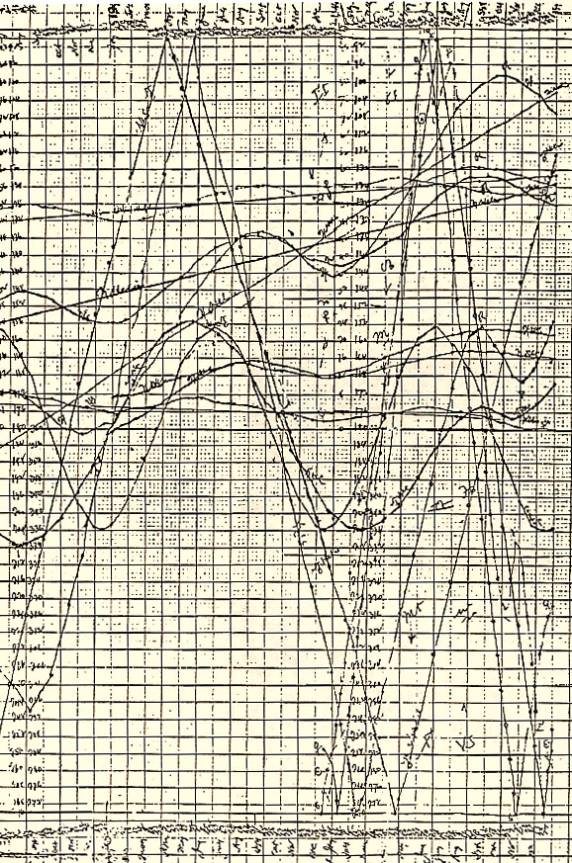
One instance that brilliantly showcased Gann’s utilization of these multifaceted techniques was his iconic call regarding Wheat in 1909. With confidence, he asserted that unless Wheat for September reached $1.20 by the end of the trading day on September 29th, 1909, it would cast doubt on the validity of his methodology.
Now, let’s delve into the chart below to truly grasp the intricacies of his assertion:
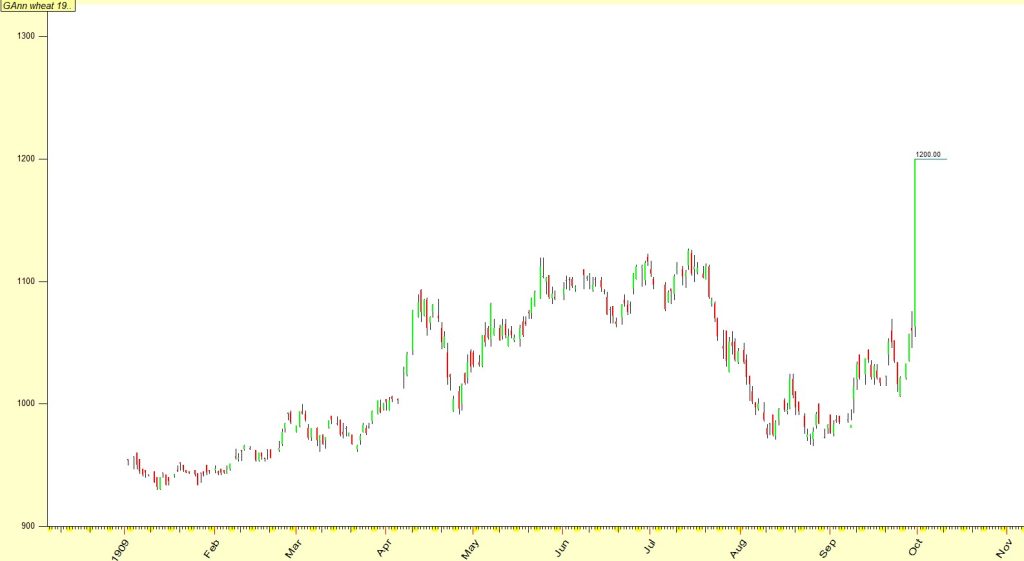
Here is the chart representing Wheat for the month of September in the year 1909.
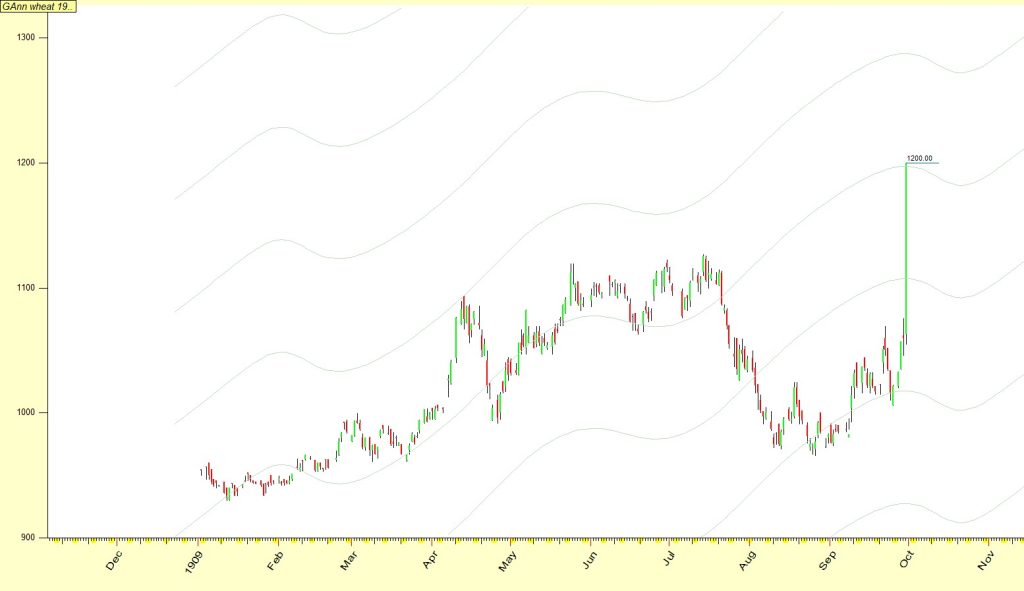
On January 13th, 1909, wheat hit a low price of 930. Subsequently, Gann diligently traced the trajectories of the mercury planetary lines (shown in gray) along with its harmonics(4th) as the days unfolded.
On April 13th, 1909, the price of wheat surged to 1094, marking a significant point in its trajectory.
This marked exactly 90 calendar days from the low recorded on January 13th, 1909 – a time frame Gann meticulously tracked across various markets. This specific day held critical importance for Gann, likely prompting him to take a short position due to its various implications.
In his literary works, Gann often referred to specific price levels as “natural levels.” These were essentially points in space where planetary configurations aligned. Such configurations could involve solar or lunar eclipses, as well as various planetary aspects in either the geocentric or heliocentric system.
April 13th was a prime example of such a date, characterized by the following planetary configurations:
- Mercury and Saturn were conjunct at 14 degrees of Aries in the Geocentric system.
- Venus and Saturn were conjunct at 13°30′ degrees of Aries in the Heliocentric system.
The significance of these degrees extended beyond mere proximity; they were intrinsically tied to the day’s high price, 1094. By performing a mathematical operation, subtracting 3 times the circle of 360 degrees from 1094 (1094 – 360 – 360 – 360), Gann arrived at the result of 14.
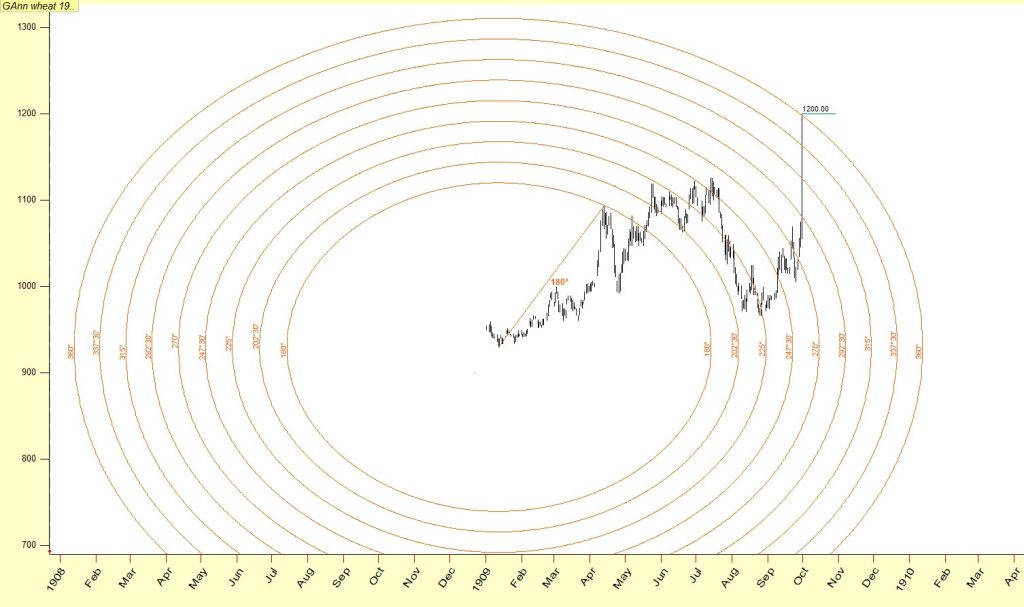
From this juncture, Gann became increasingly convinced that the January low and the April 13th high were interconnected geometrically. Armed with his trusty compass, he measured the distance between these two points on his scaled chart, laying the foundation for his subsequent calculations.
The scale he employed varied, spanning from 4×4 to 32×32, and the unit of measurement was not definitively known (whether 1 point represented 1 period or 10 points represented 1 period).
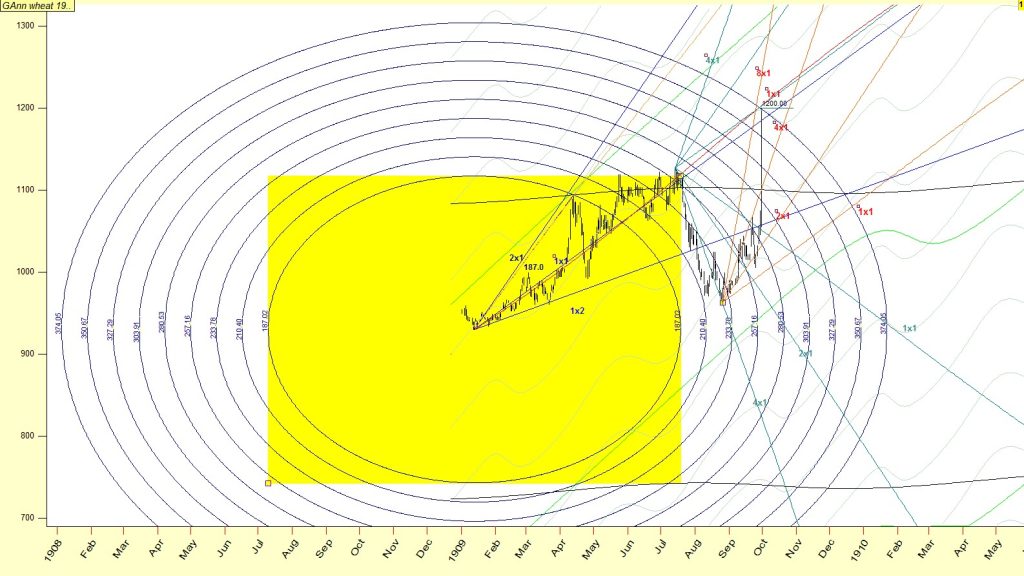
In the provided diagram, the price range extended into the thousands, with 1000 equating to 1$. Utilizing his scaled chart, Gann determined that the radius from the price of 930 to 1094 equated to 187.07 units.
((1094-930)^ 2 + (90 calendar days) ^ 2) ^.5=187.07 units
If we assume he used a scale where 1 inch represented 10 points, this would translate to a radius of 18.07 inches.
Gann, known for his affinity for the concept of octaves, expanded this radius using ratios such as 1.125, 1.25, 1.375, and so forth, culminating in a doubling (2) to signify a full octave.
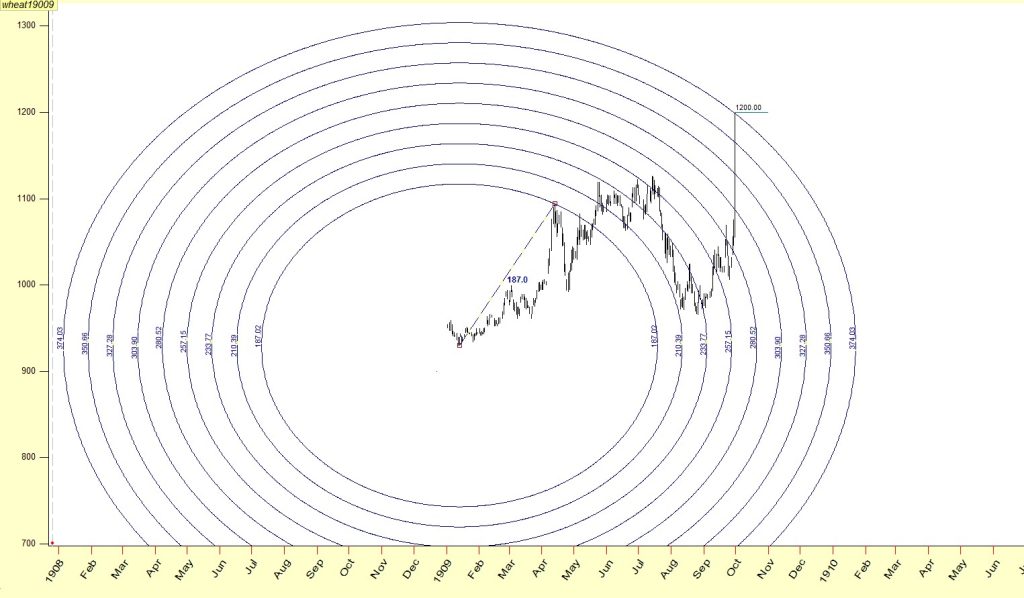
Displayed here is the expansion of the 187 units through the application of these ratios.
In addition to this, Gann incorporated his planetary lines:
- Saturn, represented by the black line, positioned at 14 degrees Aries in the Geocentric system.
- Venus, depicted in green, also at 14 degrees Aries in the Heliocentric system.
- Mercury, portrayed in grey, also positioned at 14 degrees Aries in the Geocentric system.
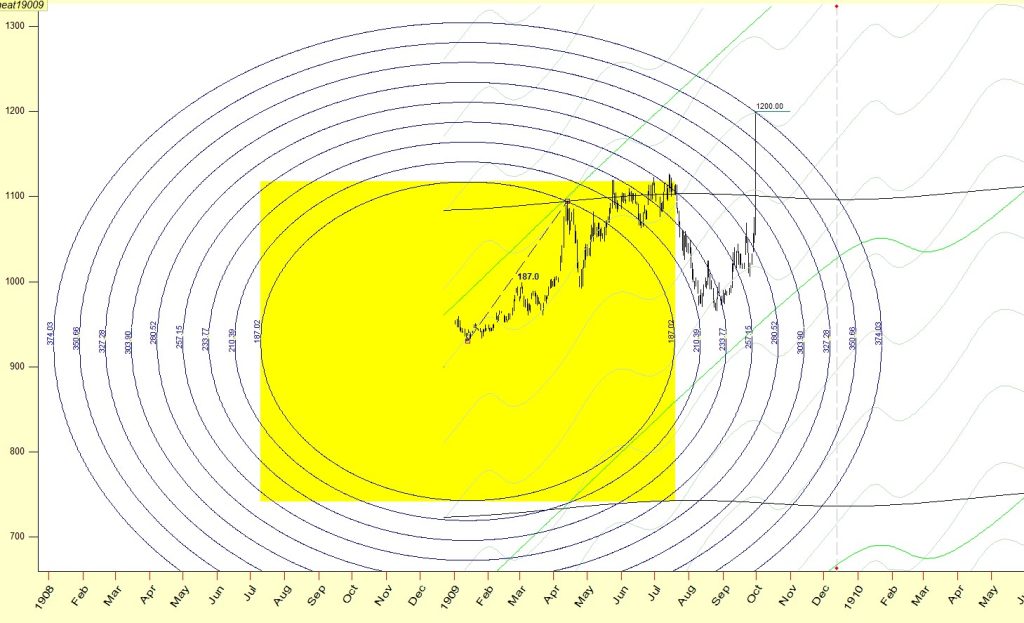
An intriguing observation emerges: the price point of 1200 coincides with the influence of Mercury, while the vector of 187.1 expands by 200%.
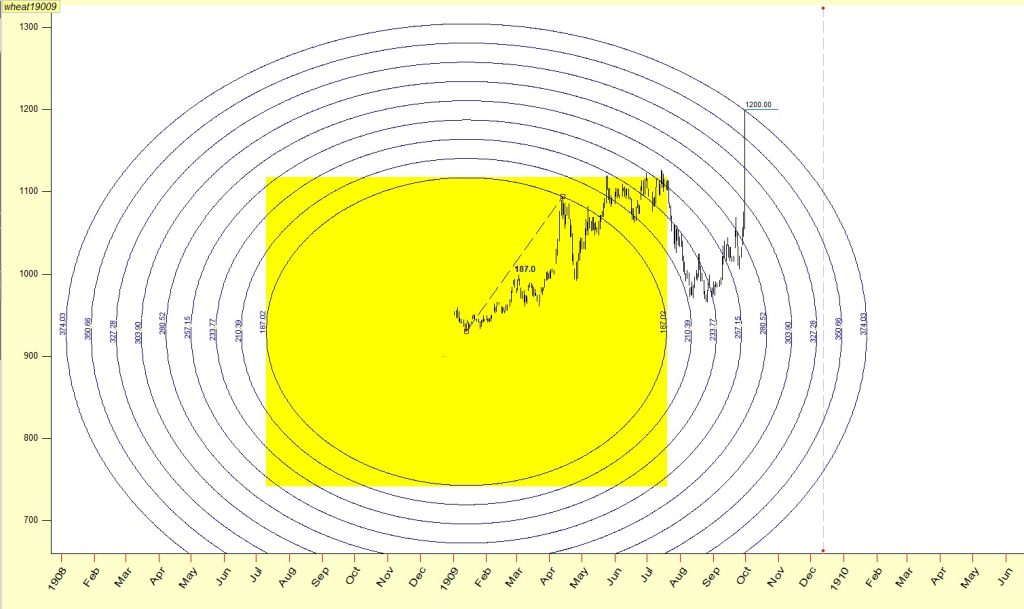
Gann consistently employed layers atop his precisely scaled charts, creating a multi-dimensional perspective.
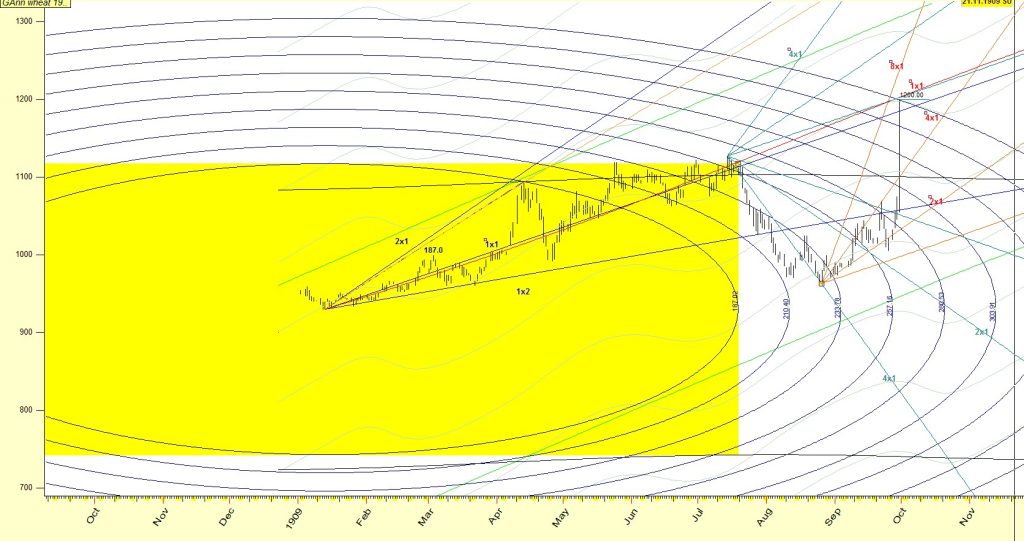
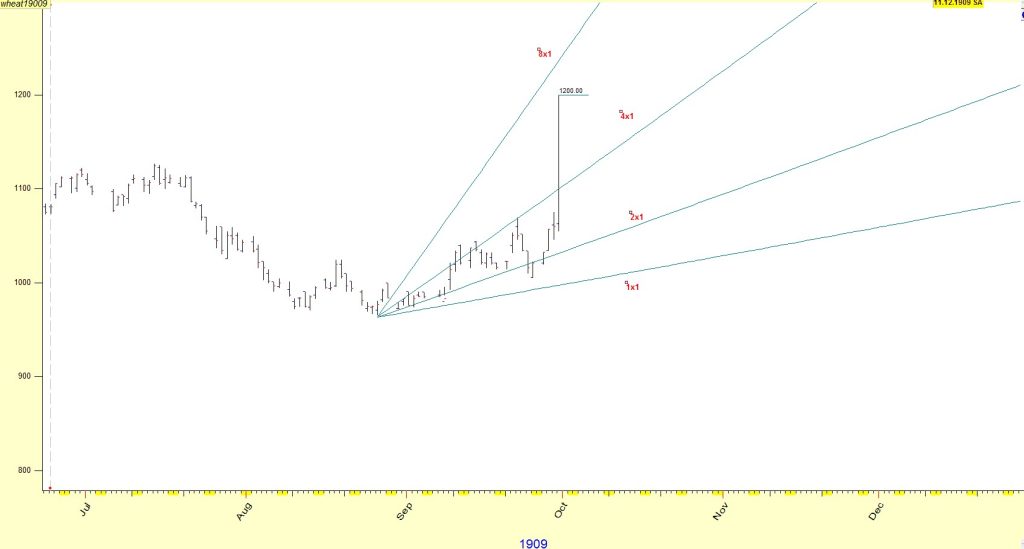
Here, once more, lie the prices along with the extensions of the low-high range (930-1094), and the angles of 1×2, 1×1, and 2×1 originating from the January low (930). These angles are set at 1 point per calendar day.
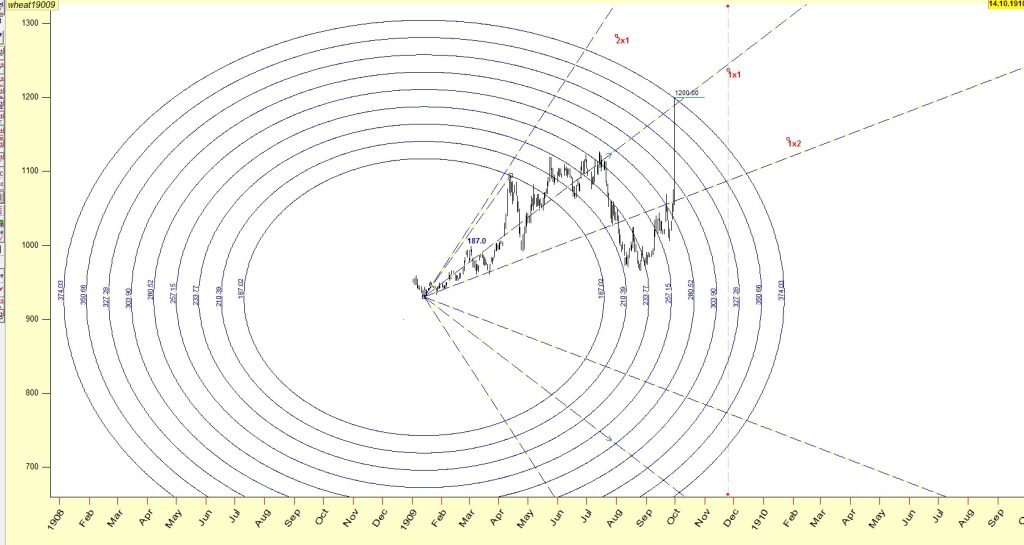
Continuing the journey, on July 15th, 1909, we note the passage of 183 calendar days from the low point of 930 on January 13th, 1909. This duration also equates to 180 solar degrees.
The price trend took a turnaround on July 14th, 1909. From this point, Gann adhered to his consistent practice, employing angles such as 1×4, 1×2, 1×1, 2×1, and 4×1 from that high to identify potential lows.
Gann harnessed the correlation of 1 point per 1 period in the daily chart, which closely approximates 1 point per 1 degree of Earth-Sun movement.
Observe below:
- 1×1 corresponds to 1 point per 1 degree.
- 2×1 corresponds to 2 points per 1 degree.
- 4×1 corresponds to 4 points per 1 degree.
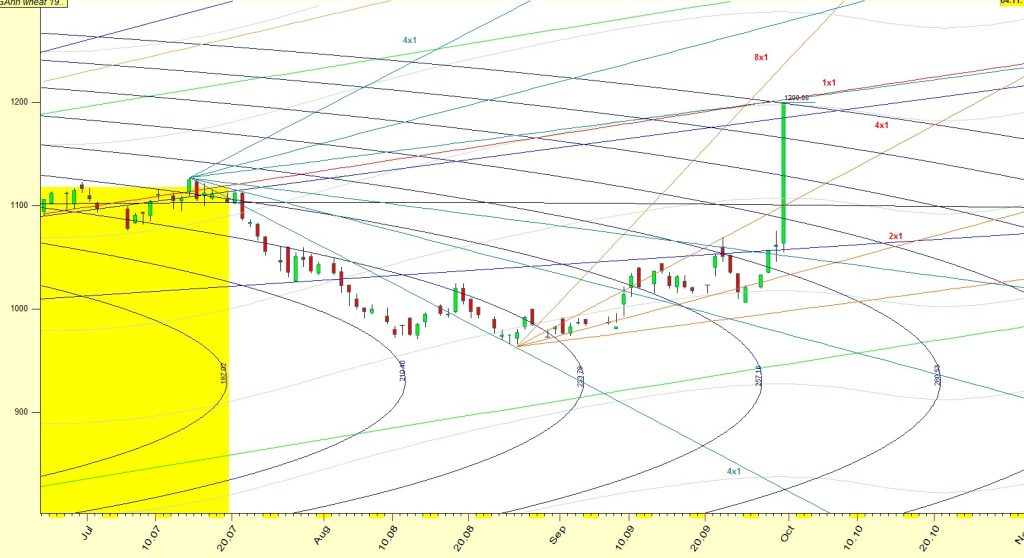
Once more, the 1200 price level was influenced by the 1×1 angle originating from July 14th, 1909.
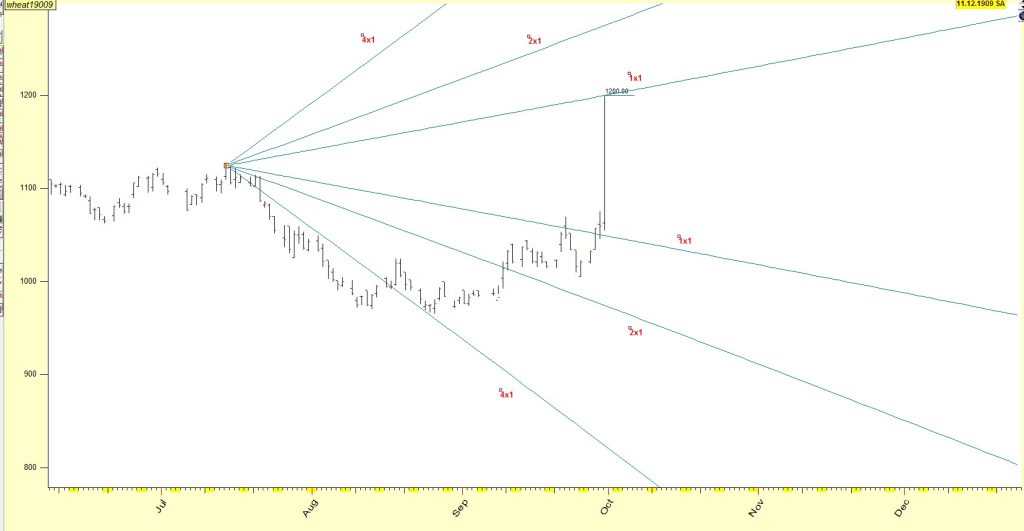
The 4×1 SUN angle, which translates to 4 points per degree of Earth’s rotation (since the Sun remains stationary in this context), traced its path from the peak of July 14th, 1909, intercepting the price movement on August 24-25, 1909.
Subsequently, Gann reverted to utilizing the SUN angles once again, this time originating from the low of August 26th, 1909, to guide his analysis.
We’ve observed the distinct setups that align with Gann’s methodology:
- Gann’s establishment of vectors using his trusty compass.
- Identification of setups upon reaching the April high, courtesy of Mercury’s conjunction with Saturn (geocentrically) and Venus’s conjunction with Saturn (heliocentrically).
- Implementation of ascending SUN angles from the peak of July, and descending SUN angles from the low of August.
- Deployment of angles rising at a rate of 1 point per 1 calendar day, originating from the January low price of 930.
Now, for the intriguing finale:
The pivotal aspect that solidified Gann’s strategic campaign revolved around the utilization of Mercury’s planetary lines. Here, once more, are those lines:

Many have noticed that it’s rare for just two planets to influence the market significantly.
Now, let’s reveal the element that was missing all along: Mars.
Look at the illustration below to understand better.
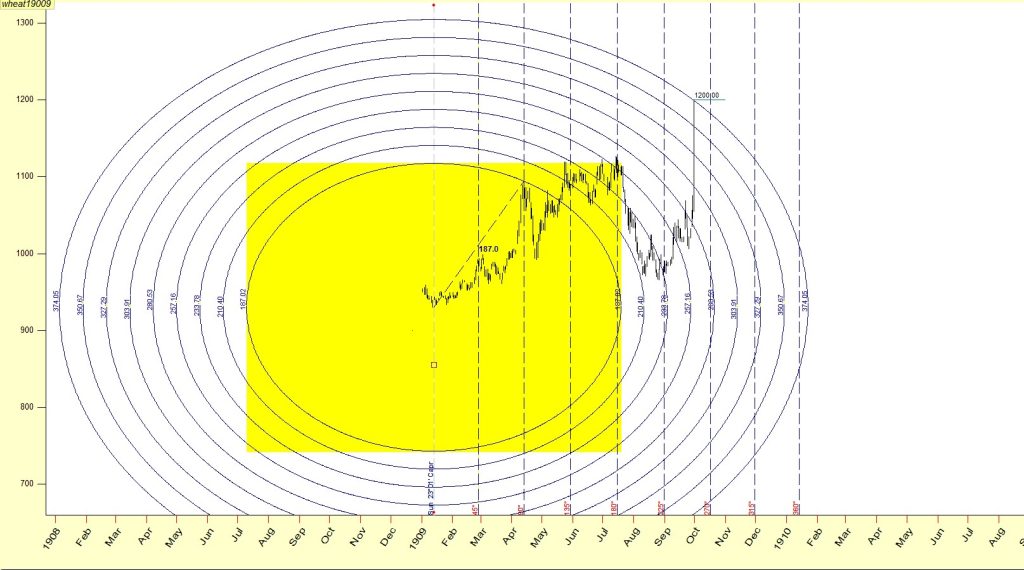
The length of the vector from 930 to 1094 (which is 187 units) can be related to the movement of the Sun. By using a simple conversion rate of 1.0569 points for every 1 degree of the Sun’s movement, this vector essentially becomes 180 units. When expanded, it becomes exactly twice that length, which is 360 units – a significant and powerful factor.
Let’s break it down even further:
By linking the points for each degree of the Sun’s movement between the low on January 13th, 1909, and the high on April 13th, 1909, which equates to 1.8 points per degree, and then associating it with a Mars Helio angle originating from the January 13th low, an intriguing result emerges.
This meticulous approach leads us to the price of around 1200, aligning with September 29th.
For a visual representation and clarification, please refer to the diagram below:

To put it in simpler terms:
Think of the orange line as tracking the Sun’s progress (or Earth’s movement) at a pace of 1.8 points for each degree. Then, envision the red line portraying Mars in the Heliocentric system, also moving at 1.8 points per degree.
Where these two lines intersect, they correspond to a price point approximately around 1201.5.
This new insight adds further weight to the strategy’s validation.
For a clear visual representation of the entire concept, refer to the comprehensive diagram below: