Transitioning from the foundational principles of the Law of Vibration, as unveiled through W.D. Gann’s interview in the “Ticker And Investment Digest,” we now delve into its practical application. Here are the essential steps to apply Gann’s Law of Vibration effectively:
- Pinpoint the onset of an uptrend or downtrend by studying the daily, weekly, or monthly price charts of the asset.
- Discern the primary astrological influence or cycle steering the trend. Analyze past cycles, especially noting all-time highs and lows, which indicate potent or weak astrological influences respectively.
- Establish the general vibration rate of the trend by using Gann angles. Employ a transparent plastic overlay with major Gann angles and their subdivisions.
- Predict the concluding date of the predominant astrological influence driving the uptrend, consulting an ephemeris and the asset’s astrological chart.
- Forecast the concluding price of the uptrend by intersecting the general vibration rate (step 3) with the forecasted ending date (step 4).
- Continuously monitor your forecast, considering that short-term positive astrological influences temporarily accelerate the vibration rate, driving prices above the long-term rate (Gann angle). Conversely, short-term negative influences temporarily lower the rate, pulling prices below the long-term angle. Ultimately, prices return to the long-term vibration when short-term influences dissipate.
illustrations of Gann’s Law of Vibration in Action:
Let’s delve into two instances where Gann’s Law of Vibration was practically applied, as outlined in his interview with the “Ticker And Investment Digest.”
Example 1: Wheat Futures Contract, September 1909 (refer to Chart 1).
During the summer of 1909, Mr. Gann made a remarkable prediction regarding September wheat futures. He confidently foresaw the price reaching $1.20 by the end of September. By noon on September 30th, the option’s value was below $1.08, seemingly challenging Gann’s foresight. Undeterred, Gann stated, “If it does not touch $1.20 by market close, it will signify a flaw in my entire calculation method. Regardless of the current price, it must reach that point.” Remarkably, September wheat achieved $1.20 in the final trading hour, proving Gann’s prediction accurate (according to the Ticker interview).
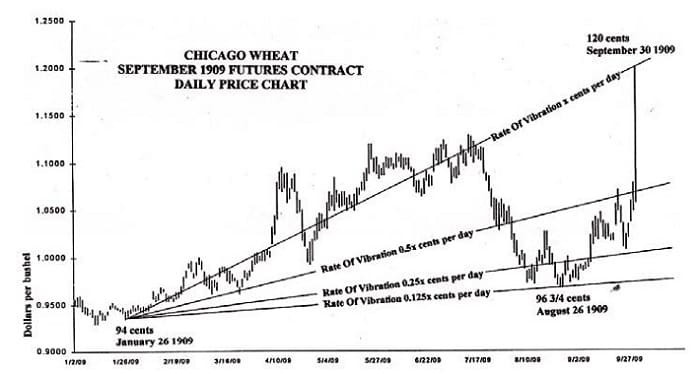
- Pinpointing the onset of the uptrend in the September 1909 wheat futures contract, Gann marked it at 94 cents on January 26, 1909.
- Gann identified the prevailing astrological influences propelling this upward trend.
- Unveiling the enduring rhythm of this uptrend, Gann determined its long-term vibration rate of 0.1053 cents per day (equivalent to 1 cent per 9.5 days).
- Gann’s foresight extended, anticipating that the dominant astrological influences driving this uptrend would endure until the contract’s culmination on September 30, 1909.
- With the launch point (point 1 above), the steadfast vibration rate (point 3), and the contract’s termination date in mind, Gann predicted a closing price of $1.20 at the contract’s end.
- Vigilant in his observations, Gann noted how short-term astrological impacts, since January 26, 1909, occasionally propelled prices beyond or below the steady vibration rate. He further documented the period between July 21 and August 26, 1909, when potent short-term negative influences dipped prices well below the enduring vibration rate. However, Gann observed that from August 26, 1909 (the low point of 96¾ cents), these adverse influences gradually waned, projected to expire in the coming month, allowing prices to revert to their established long-term vibration rate.
Significantly, Gann’s conviction found support in the August 26, 1909 low of 96¾ cents, corresponding to a vibration rate of 0.0132 cents per day (derived from the January 26, 1909, starting point of 94 cents). This rhythm echoes one-eighth of the enduring vibration rate of 0.1053 cents per day. Another lens unveils that by August 26, 1909, the long-term vibration rate for this wheat futures contract had undergone three halvings. As August 26, 1909, unfolded, Gann predicted and subsequently observed the dual expiration of short-term adverse astrological effects and the triumphant return to the tripled vibration rate, culminating in the restoration of the long-term rhythm by September 30, 1909.
Example 2: United States Steel Stock Price (refer to chart 2).
Gann’s prescience shone when he assessed United States Steel’s value at about 50, confidently predicting an ascent to 58, yet affirming it wouldn’t breach 59. He forecasted a subsequent plunge of 16¾ points. Seizing the opportunity, we shorted it near 58 3/8, capping the rise at 58¾. What ensued was a descent to 41¼, a significant drop of 17½ points (as reported in the Ticker article).
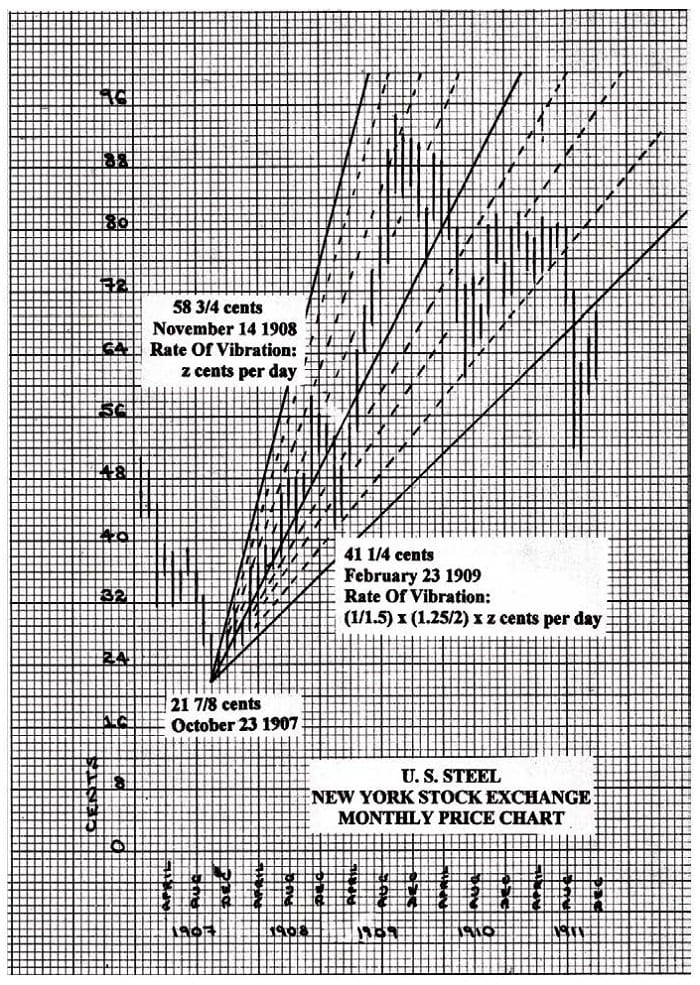
- Gann kicked off the U.S. Steel uptrend with a bang at 21-7/8 cents on October 23, 1907.
- Gann unraveled the cosmic gears driving this uptrend’s engine.
- Gann calculated the uptrend’s groove, dancing to a beat of 0.0950 cents daily (1 cent per 10.5 days).
- With an astrological crystal ball in hand, Gann glimpsed the uptrend’s celestial course until October 1909, predicting a flirtatious dance with a November 1908 short-term dip. In this financial tango, Gann crooned his tune as U.S. Steel hovered around 50, foretelling a brief waltz on November 14, 1908, sparked by prickly astrological partners.
- Driven by the uptrend’s ignition (point 1), the rhythmic vibrations (point 3), and the correction’s onset (point 4), Gann orchestrated a crescendo: U.S. Steel ascending to 58, a melody refusing to flirt with 59. The stage was set, and on November 14, 1908, U.S. Steel’s price swirled to a peak of 58¾, sealing the deal.
- Gann foresaw cosmic ripples painting the canvas until February 23, 1909.
- Gann unraveled the vibrations’ rhythm on February 23, 1909, revealing a chart-worthy masterpiece. A slide to the bottom of U.S. Steel’s sonic spectrum followed by a wild drop three-quarter below—the prelude to a climactic flourish. February 23, 1909, painted a low price of 41¼ cents, a synchronized dance to the rhythm of 0.0396 cents per day. From this symphonic low point, U.S. Steel resurfaced, ready for its encore—a resumption of the long-term uptrend.
This tale uncovers Gann’s mastery, not just as a market maestro but as a cosmic composer, orchestrating rhythms, predicting crescendos, and guiding the dance of stocks and commodities. Gann’s Law Of Vibration becomes a musical score, where each note shapes support and resistance, echoing his prophetic words on the power of vibrations in the financial world.
Furthermore, this principle acts as a spotlight on a somewhat enigmatic notion that Gann fleetingly introduced in his stock market and commodities courses—the intriguing ‘concept of lost motion’:
As there is lost motion in every kind of machinery, so there is lost motion in the stock market due to momentum, which drives a stock slightly above or below a resistance level. The average lost motion is 1 7/8 points. When a stock is very active and advances or declines fast on heavy volume, it will often go from 1 to 1 7/8 points above a halfway point or other strong resistance level and not go 3 points. The same rule applies on a decline. It will often pass an important resistance point by 1 7/8 points but not go 3 full points beyond it. That is why I advise using a stop-loss order 3 points above a top or 3 points below a bottom”.
W. D. Gann Stock Market Course, Chapter 10
In recap, delving into instances of Gann’s Law Of Vibration in action, we’ve illuminated three more guiding principles within this realm:
- The vibrations of stocks and commodities resonate with a spectrum of principal energy levels and subshells. Specifically, these energy levels mirror doubling and halving vibrations, while subshells mirror a fourfold division of an energy level.
- These energy levels and subshells form the bedrock of significant support and resistance points.
- In the midst of fervent market activity, momentum often teases a stock’s price just beyond the precise support or resistance juncture, as dictated by the dance of vibrations (alongside astrological forces).