The Trend Angle Indicator is a technical analysis tool used to determine the angle and slope of a price trend.
- It helps traders identify the strength and sustainability of a trend.
- It usually represents the angle at which the price is moving on a chart.
In this example, We are using the chart of Bank NIFTY in a Daily timeframe.
You can easily tell from the naked eye that it is in an uptrend. So, Let’s check the trend angle.
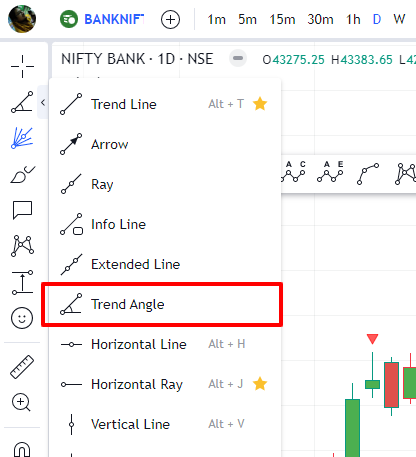
- After clicking on the indicator,
- Click on the Bottom of the trend.
- Click on the Top of the trend.
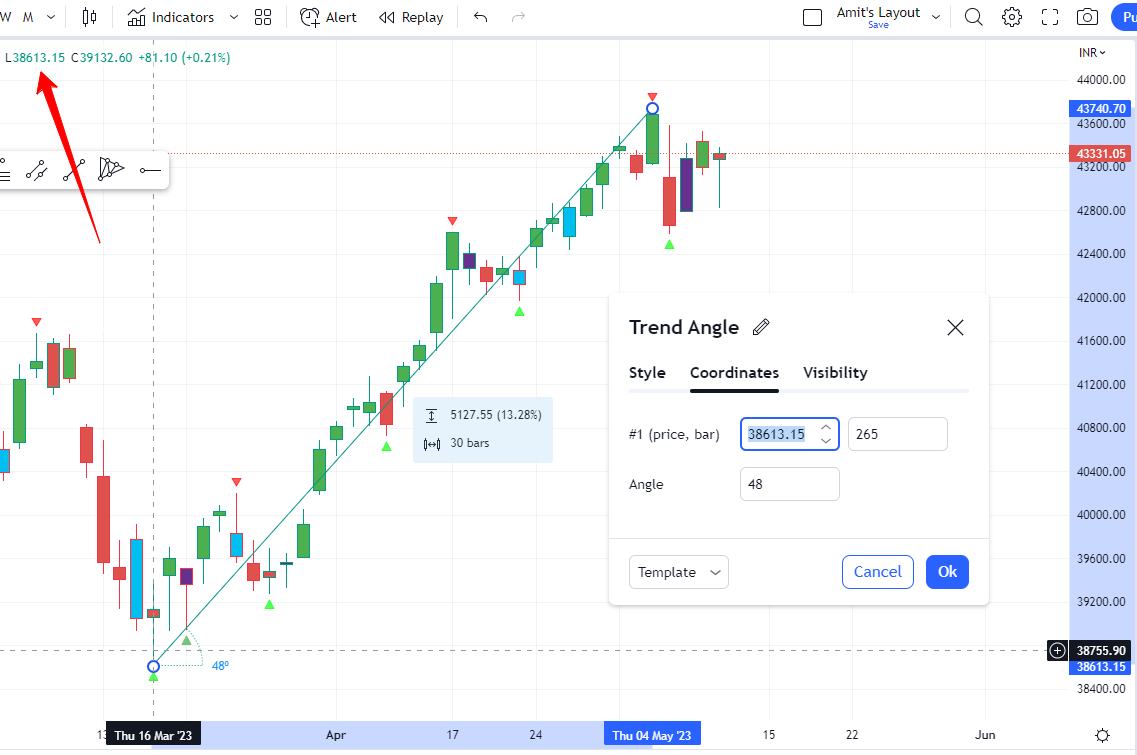
Alternatively, you can double click on the new line that is created by the indicator. Under the tab Coordinates You can enter the starting point manually.
In the “Style” tab, you can see the settings Price range, Percentage Change, Bars range are turned on.
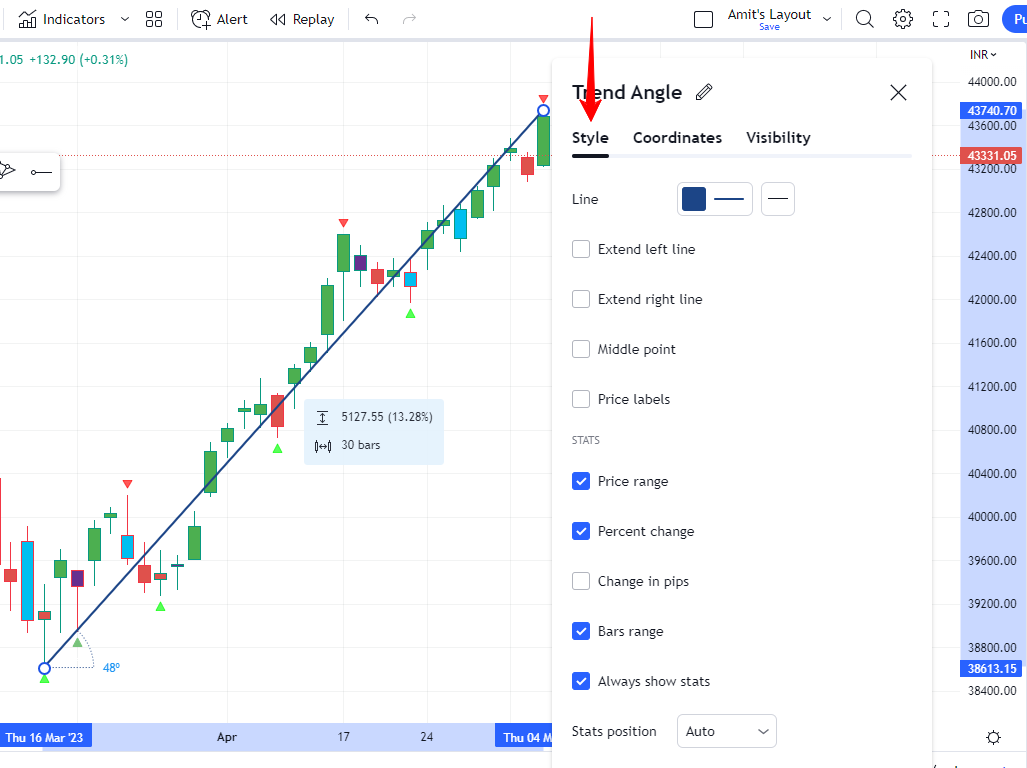
Also, you can notice that the color and thickness of the line has been changed.
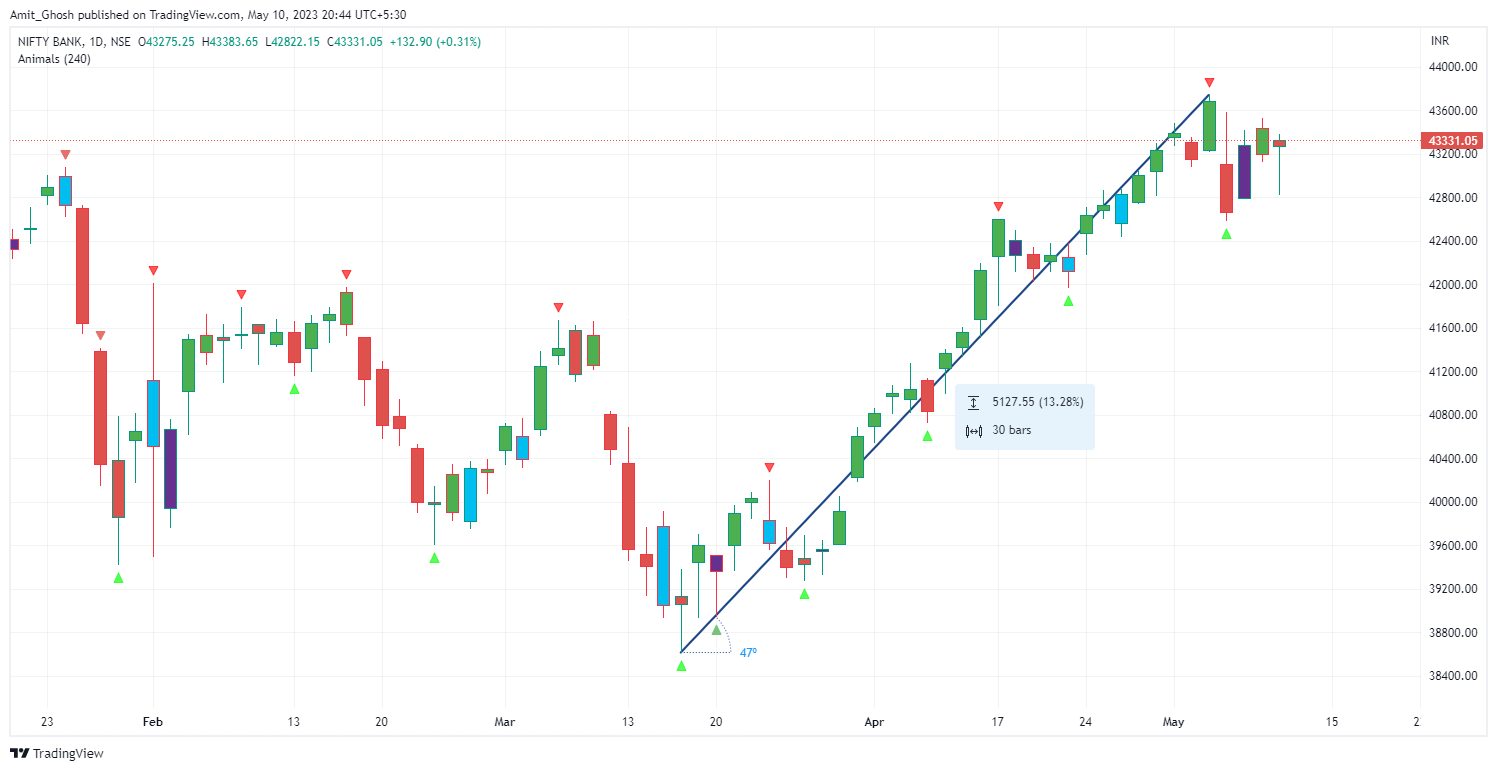
So, this is the final output – The trend angle here is 47 degrees.
Variations in Trend Angle
There is a high chance while replicating this method, you will reach something other than 47 degrees.
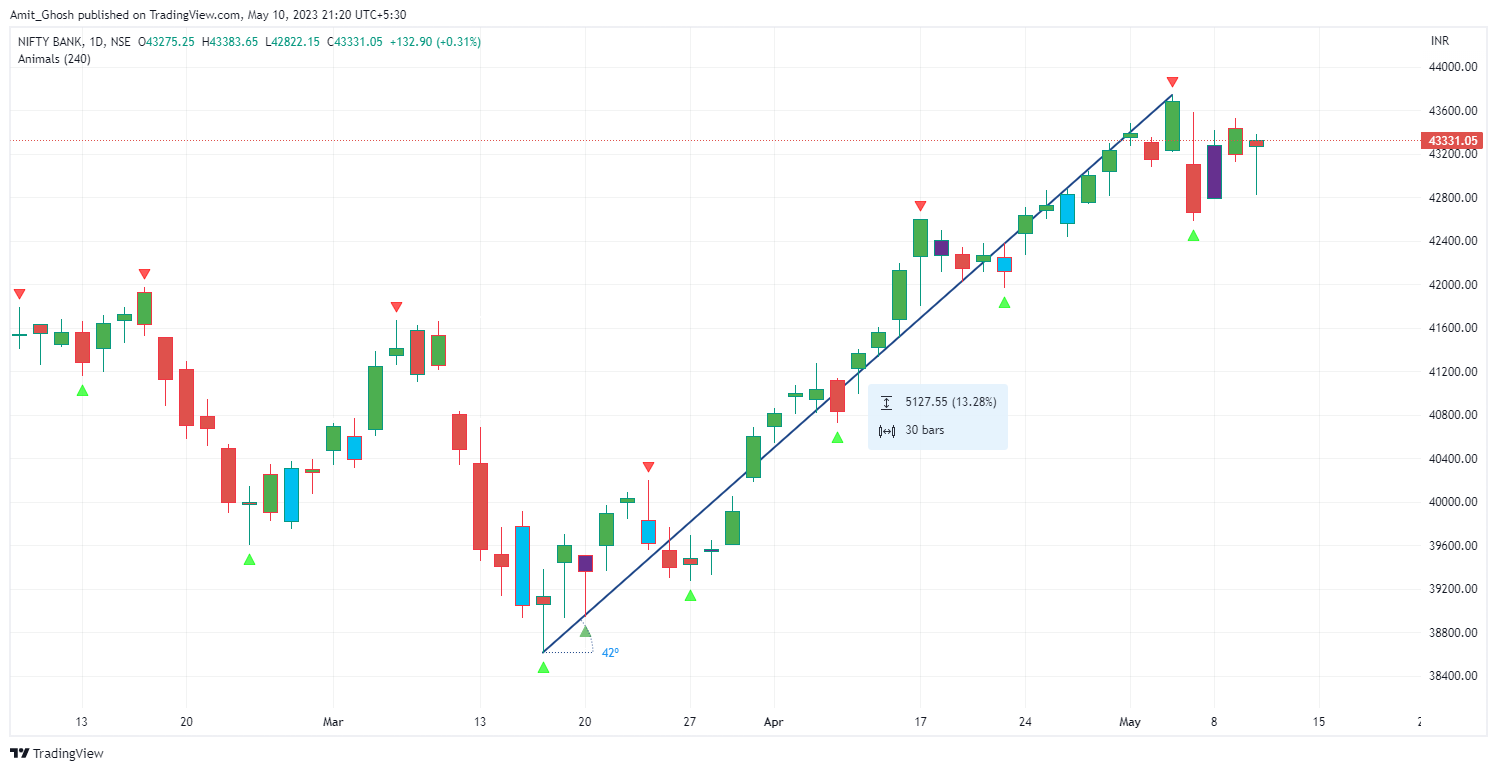
It will be variations. Here is an example with 42 degrees!
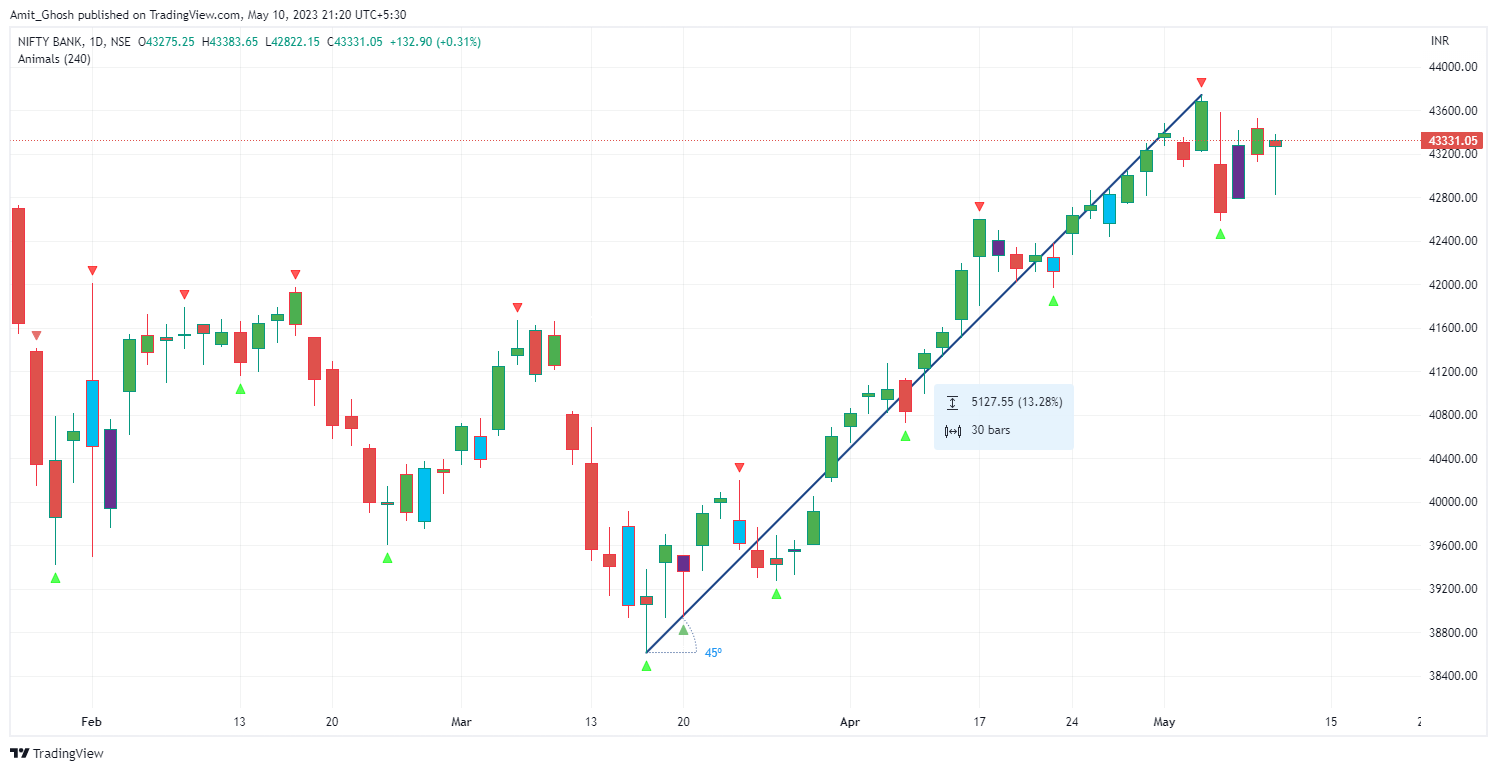
45 Degrees!
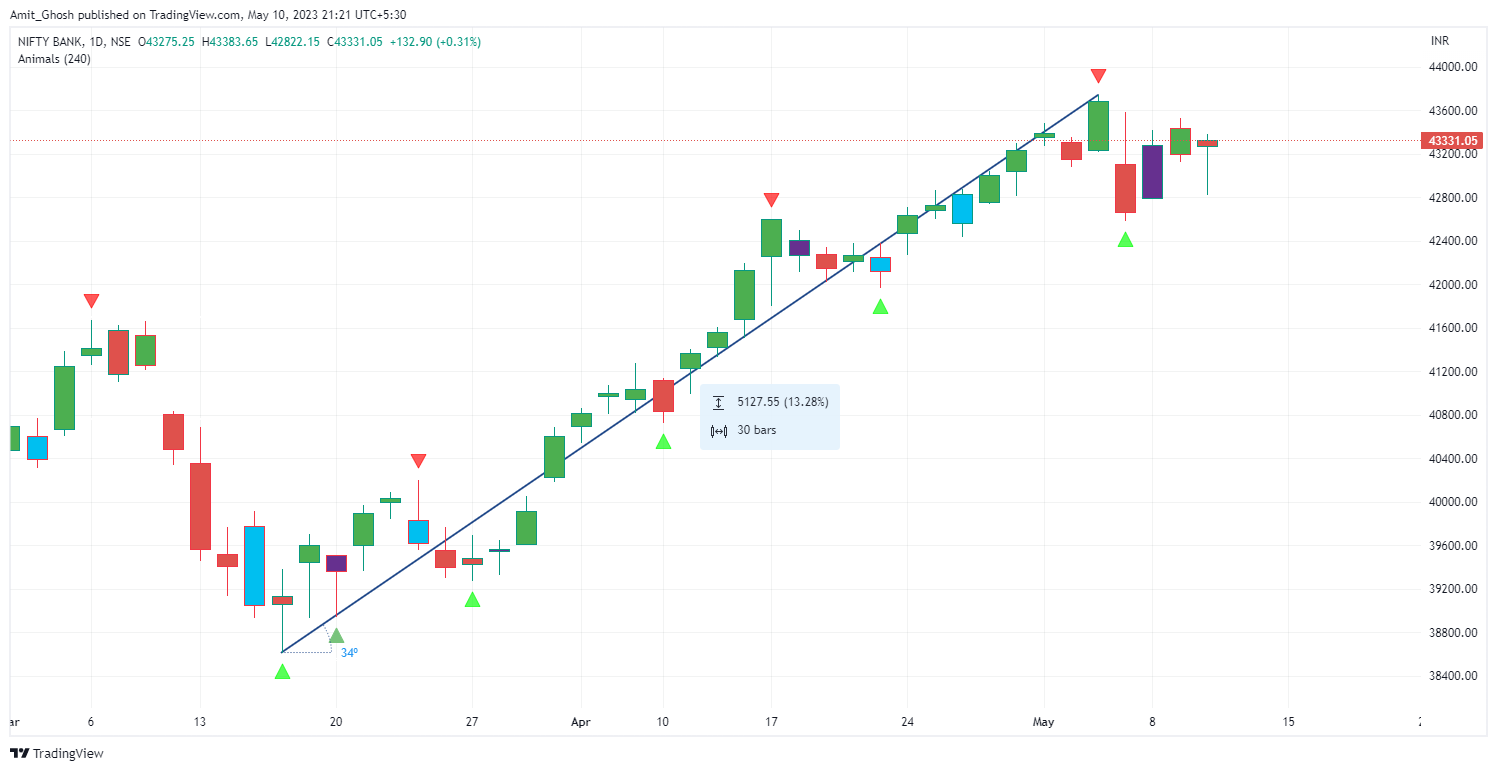
34 Degrees!
But, all of the Trend Angles are made using the same points in the same chart?