W.D. Gann, born in 1878 in Lufkin, Texas, was a trailblazer in the realm of market analysis, focusing on time and price patterns. His fundamental belief revolved around the idea that the future mirrored the past, with time being the driving force behind market dynamics. Gann not only applied but also imparted techniques for forecasting market peaks and troughs through his expertise in time and price analysis, earning a reputation for predicting annual highs and lows in both commodities and stocks.
W.D. Gann, a dedicated trader and industrious individual, authored several books, some of which include:
- The Truth of the Stock Tape
- How to Make Profits from Puts and Calls
- Tunnel through the Air
- Magic Word
- How to Make Profits in Commodities
- 45 Years In Wall Street and New Stock Trend Detector As well he produced many
- Instructional trading courses originally developed by W.D. Gann and later compiled into two comprehensive trading courses by Billy Jones comprise:
The W.D. Gann Commodity Course and the W.D. Gann Stock Market Course.
W.D. Gann, a prolific researcher with diverse interests in numerology, weather forecasting, and astrology, drew inspiration from the Bible and his advanced understanding of mathematical and astrological relationships to develop trading and technical analysis techniques. As a devoutly religious 33rd-degree Mason, Gann’s unique insights allowed students to identify crucial support and resistance levels across various free trading markets.
Gann and R.N. Elliott, the creator of Elliott Wave theory, held similar beliefs about market behavior. Gann thought that Bull or Bear campaigns had 3 or 4 sections to complete the move, while Elliott believed in 3 impulse waves in a trend, with the chance of an extended 5th Wave, mirroring Gann’s 4th section. Gann observed that markets frequently retraced 1/2 (50%), 5/8s (62.5%), or 3/8s (37.5%) of the previous range, whereas Elliott saw common retracements at 61.8%, 50%, or 38.2% of the prior range.
Gann possessed an array of price tools, reportedly charging $5000 for a weekend course in the early 1950s before his 1955 passing. This article delves into many of Gann’s vital time and price tools. Future articles will explore additional tools like The Square of Nine, Square of 144, Square of 90, Hexagon Chart, and Gann’s Master Calculators. Gann’s books are essential reading for traders and analysts seeking a fundamental understanding of market analysis. His knowledge, although abundant, carries a consistent pattern throughout his works, emphasizing his belief that “History Repeats” and that repetition was key for students to grasp his teachings.
Gann’s work encompassed Money Management Rules and Trading Psychology concepts that are now embraced by many leading traders. He advocated the idea that one didn’t need to be constantly active in the market to profit. In his final book, “How to Make Profits in Commodities,” Gann shared wisdom that remains relevant today. On page 11, he stated, “TIME TO STAY OUT OF THE MARKET: This is something important for everyone to know. You cannot make money by trading in the market every day or by getting in and out every day. There comes a time when you should stay out, WATCH, and WAIT until you determine a DEFINITE CHANGE IN TREND. Long periods of rest and relaxation protect your health and help your judgment which will result in profits later.”
“The best way to trade: The most money is made by swing trading or in the long pull trades. That is, following a definite trend as long as the market trend is up or down. You must learn by rules to wait until the market gets out of a rut or a trading range. Wait for a definite indication that it is going higher or lower before you take a position for a long pull trade. Always figure that YOU CAN BE WRONG and that the market could reverse. Therefore, follow your profits up with a STOP LOSS ORDER, or get out when you get a definite indication that the market has reached a turning point and that the trend is changing.”
As visuals often convey more than words, let’s delve into some charts. Please scrutinize each chart carefully, as they contain crucial insights.
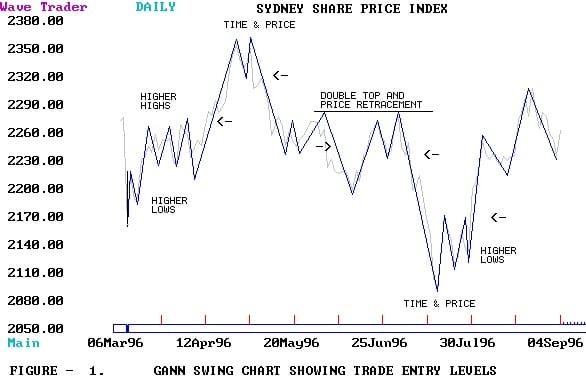
Gann’s primary trading philosophy revolved around employing a tight stop-loss strategy and carefully selecting the most advantageous trades aligned with the prevailing trend. To confirm the presence of a trend, he would scrutinize the formation of lower highs and higher lows following a significant trend reversal. Gann relied on the Swing Chart as a tool to track trends and eliminate market noise, as illustrated in Figure 1. For instance, after July 30, 1996, Gann would have identified an upward trend in the SPI due to the formation of higher lows and higher highs, making him a buyer of the SPI from 2170.
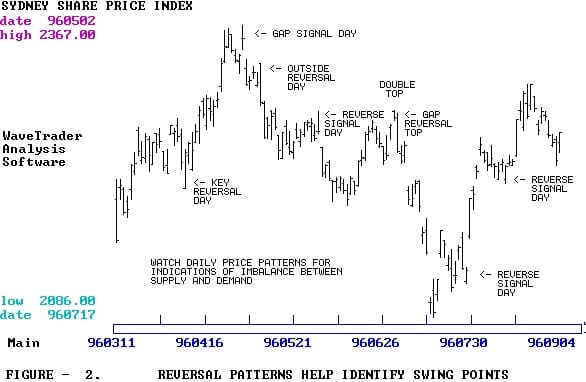
Gann attributed significant significance to daily price patterns and extensively discussed various reversal patterns that could be utilized to detect imbalances between supply and demand. In Figure 2, you can observe some of the bar chart patterns that Gann closely examined to validate potential turning points or swiftly exit trades while minimizing losses.
Gann emphasized the importance of facing reality and eliminating both hope and fear in trading. He advised that when a trader receives a margin call, it’s best to close the position promptly because it’s likely that they are on the wrong side of the market. Moreover, Gann stressed the value of studying human nature and often going against the crowd. Many traders lose money due to greed, overtrading, and unrealistic profit expectations.
Gann’s analytical methods for predicting significant market highs and lows revolved around cycles. He firmly believed that the future simply repeated patterns from the past. Gann’s 20-year cycle was founded on the premise that human nature remains consistent. Thus, each new generation entering the markets would exhibit similar behavior, leading to bull and bear markets. These inexperienced speculators would drive prices to levels not justified by supply and demand. Consequently, once the boom ended, the younger generation would endure substantial losses, gaining valuable experience and becoming less eager to reenter the market. To forecast a yearly top or bottom, Gann scrutinized market activity from various years in the past, examining conditions 10, 20, 30, 40, 50, 60, and 100 years prior for similarities.
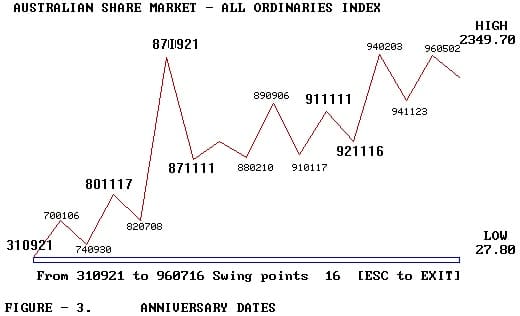
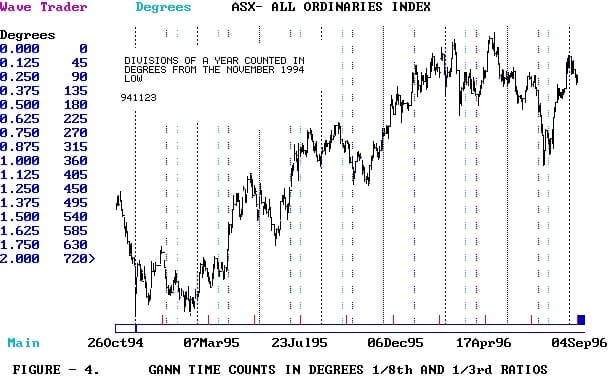
One fundamental technique that Gann instilled in his students was the observation of anniversary dates associated with previous market tops and bottoms as potential indicators of a trend change. For shorter-term time analysis, Gann developed a method of measuring time using solar degrees within a year, starting from past market tops and bottoms. He divided the year into eighths and thirds and looked for instances where multiple time counts from historical turning points converged on a future date, signifying its significance for a potential trend reversal.
Refer to the chart below for the key anniversaries in the All Ordinaries.
The annual cycle consists of 365 days, while a complete circle represents one year with 360 degrees. Earth follows an elliptical orbit around the Sun, resulting in variations in the speed of days and degrees. To illustrate, consider the four cardinal points on this circular path: 90, 180, 270, and 360 degrees. As Earth orbits the Sun, the length of daylight gradually increases and decreases every six months. In the Southern hemisphere, the shortest day falls on June 21 (while it’s the longest day in the Northern hemisphere), known as the Winter Solstice (at 270 degrees). Conversely, the longest day of the year occurs on December 22 (at 90 degrees), marking the Summer Solstice.
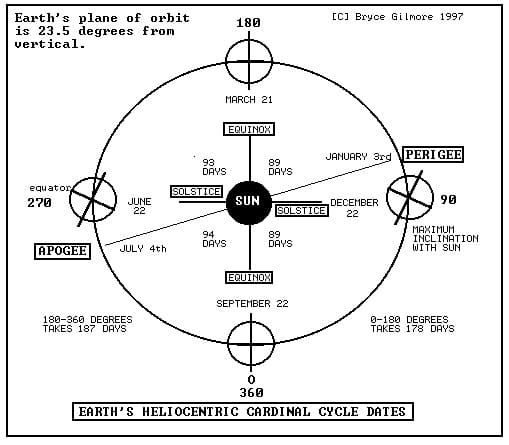
On September 21 (at 360 degrees) and March 21 (at 180 degrees), we experience the Equinoxes, those unique moments when daylight and darkness are in perfect balance.
These four cardinal points dictate the changing seasons throughout the year. However, it’s essential to recognize that some individuals might perceive these cardinal points as being 180 degrees apart from the explanation provided. To illustrate, refer to Figure – 4, where you’ll notice that the peak at 2310 in late August 1996 coincided with a period of 1.75 years, equivalent to 630 solar degrees, counted from the low point on November 23, 1994, at 1793.
It’s crucial to understand that the Earth follows an intriguing pattern in its orbit around the Sun. It takes 179 days to journey from 0 degrees to 180 degrees. However, the subsequent leg of its journey, from 180 degrees to 360 degrees, requires 186 days. This shift in the relationship between days and degrees, characterized by acceleration and deceleration, centers around two significant points in the Earth’s annual orbit: the perigee and the apogee. The perigee, marking the point when the Earth is closest to the Sun, typically occurs around January 3 each year. Conversely, the apogee, signifying the Earth’s farthest point from the Sun, typically transpires on July 4 annually.
When analyzing cycles, it’s advisable to work with degrees for increased precision. To achieve this level of accuracy, you’ll require tools like an ephemeris or a computer program, such as Gannzilla, capable of precisely calculating degrees. W.D. Gann devised a unique method for aligning price with time and time with price. He emphasized that every stock or commodity had its own distinct vibration, where a specific relationship existed between one degree of price and one degree of time. The challenge often lies in determining the value that represents one degree of price for various stocks and commodities. In this demonstration, I’ve used the All Ordinaries Index and maintained a simple ratio of 1 unit of price to 1 unit of time. It’s important to note that different markets may square price to time in various ways.
- The duration of price movements in a trend corresponds to the duration of time movements in that same trend.
- The initial price level marks the time units needed for a new trend reversal.
- The previous price range determines the time units required for a new trend reversal.
- The preceding time units determine the next price range for a new trend reversal.
- The current price aligns with the time units elapsed since the last trend change (represented by a zero angle).
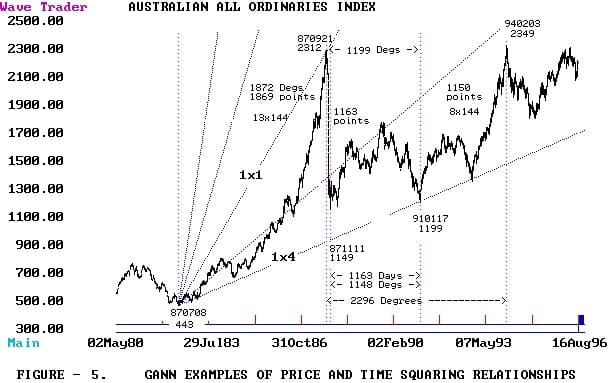
To monitor the alignment of price and time, Gann employed the use of Gann Angles. These angles originated from market lows when drawn upwards and from market highs when drawn downwards. Gann’s toolkit included angles such as 4 to 1, 2 to 1, 1 to 2, and 1 to 4. For instance, 1-4 represents the ratio of 1 unit of time to 1/4 unit of price. In Figure 5, you can observe instances where Gann applied these methods to anticipate potential trend changes.
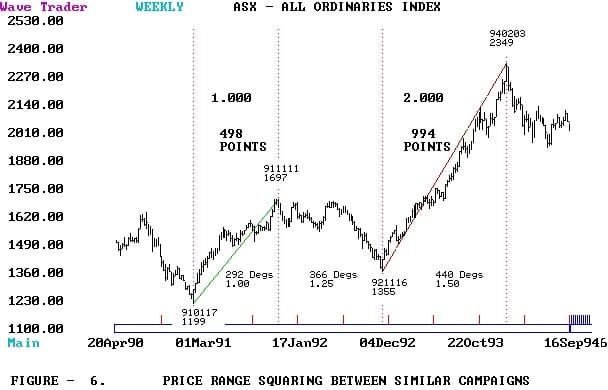
Gann emphasized the significance of achieving harmony or “squared” alignments between price ranges. These could involve retracement levels or shifts in market sentiment. A clear illustration of this concept is evident in the behavior of the All Ordinaries Index between 1991 and 1994, as depicted in Figure 6. Notably, Range 2 is precisely 2 times Range 1, highlighting the importance of these squared relationships.
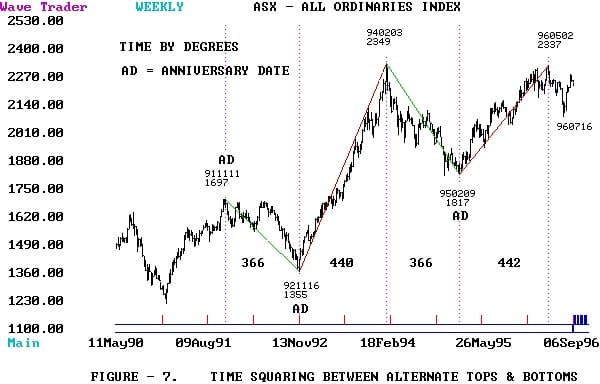
The illustration presented in Figure 7 serves as a quintessential embodiment of Gann’s profound understanding of order within the market. It vividly demonstrates how time and degrees align in an alternating fashion between significant tops and bottoms, perfectly exemplifying Gann’s principles of order and harmony. This example is bound to captivate the attention of any trader or analyst.
Upon encountering Gann’s profound statement, “Time is the most important indicator. When time is up, the market must change trend,” I embarked on a transformative journey into the realm of market understanding. This revelation has granted me the invaluable gift of patience, enabling me to await significant trading opportunities. The principles elucidated here are applicable across a spectrum of market trends, spanning durations from as short as 7 days to as long as 5 years.
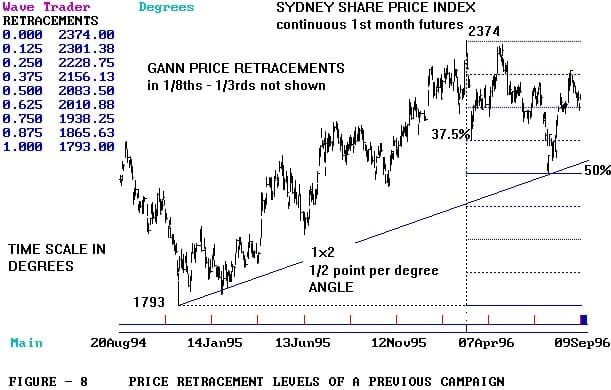
Price retracement levels, familiar to most analysts for their role as support or resistance between trends of similar degree, were also emphasized by Gann. His approach involved measuring previous price ranges and dividing them into 1/8ths and 1/3rds, which could serve as support during downtrends or resistance during uptrends. When the market reaches these levels and then reverses, confirming a trend change becomes a matter of examining the clustering of time cycles on that particular day. Gann angles, furthermore, help determine intersections of time and price. In Figure – 8, we observe the SPI’s recent low at 2086 on July 17, which precisely hit the 50% retracement level, while the post-election panic low on March 11 at 2158 was situated on a 37.5% retracement.
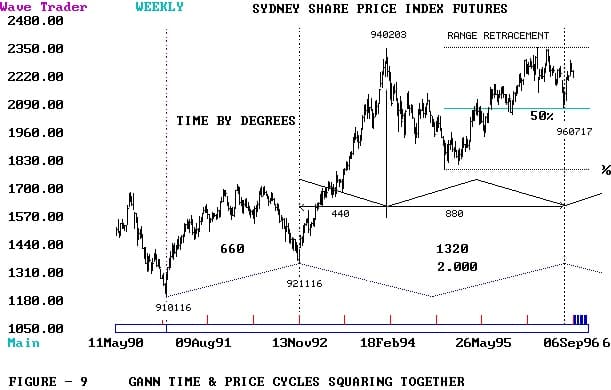
On July 17, 1996, a pivotal event unfolded as the SPI dramatically reversed its trend, precisely at the 50% retracement level, marking the culmination of all the gains achieved between 1994 and 1996. This crucial turning point coincided with several important time cycles reaching their peak. Two notable cycles are highlighted here: first, the period between the major lows in 1991 and 1992, cycling at a factor of 2.00; and second, the time span between the 1992 low and the 1994 high, cycling at precisely 2.00 as well. It’s truly remarkable how the market consistently adheres to this geometric oscillation pattern between highs and lows.
Identifying these time cycles in advance might seem daunting to many, but it’s surprisingly attainable. The charts in this article were generated using my personal WAVETRADER / CYCLETRADER SOFTWARE, a tool I painstakingly designed and developed to gain a competitive edge in the market. Over the years, I’ve diligently refined and upgraded the software based on my evolving experiences. In 1996, I finally felt that I had created a tool that offered complete control over my trading destiny. Along the way, I’ve made this software available to fellow traders, benefitting greatly from their invaluable feedback. I’ve observed that there’s a constant influx of new individuals entering the market, initially experiencing losses. Some exit the market altogether, while others regroup, seeking to learn methods that can transform them into successful traders.
However, the underlying truth remains that every trader requires tools and methodologies to craft a low-risk trading plan, one that can be executed mechanically while maintaining a consistent trade selection process. Once this trade selection process is systematized into a structured approach, the trader must implement an effective money management plan to ensure long-term success.
Gann’s wisdom succinctly encapsulates these principles, emphasizing that trading should not rely on guesswork or hope. Profits are born from knowledge. He staunchly advocated against trading without STOP LOSS ORDERS. I hope that these brief examples of technical analysis methods illustrate the possibilities that await diligent traders who are willing to put in the effort.