In today’s world of intricate high-tech buzz and pricey market systems, the divide between theory and market reality often yawns wide, riddled with pitfalls of curve-fitting flops. Yet, a mathematical gem fashioned by master trader W. D. Gann over half a century ago continues to grace the 1980s market stage, aligning seamlessly with his original vision. In his early forays, Gann astutely perceived an enchanting connection between price and time, an interplay often overshadowed by the clamor for price forecasts. Typically, time drifts like a tranquil wave, distinct from the fervor of price action.
Gann’s ingenious solution entailed crafting clear overlays, elegantly segmented into Price and Time intervals like 360, 90, or 144. These overlays, affectionately dubbed “MASTER PRICE & TIME CALCULATORS,” were poised over significant market crests and troughs, gracefully tracing their trajectory across monthly, weekly, and daily bar charts. These steadfast geometric allies embarked on a noble quest to decipher market vigor, vulnerabilities, and, most captivatingly, the intricate interweaving of price kinetics with the elusive dimension of time. Through devoted study, this Calculator’s prowess extends seamlessly to yearly, monthly, weekly, daily, and even intraday bar charts. Interestingly, during the throes of the Great Depression, Mr. Gann sought $5000 for a weekend to impart the art of its usage, imparting enlightenment. Fast-forward to today’s landscape, the formidable “GannZilla” software democratizes access to this powerful tool, placing it within the reach of anyone with a personal computer, an empowering conduit to unlock its mesmerizing insights.
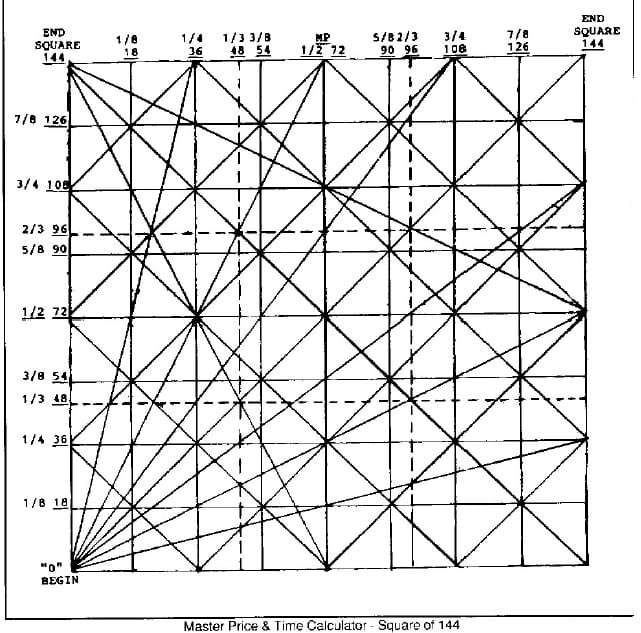
Let’s take a closer peek into the MASTER PRICE & TIME CALCULATOR’s blueprint. Imagine the timeline stretched horizontally and the price rising vertically. This ‘square,’ though actually a rectangle, is sliced into neat eighths and thirds along both axes. Over time, Gann observed a captivating pattern: as prices met the Time ‘End’ of this geometric framework (where price and time harmonize), it often signaled a shift in direction, often accompanied by a surge of newfound energy in the opposite way. Gann also spotted pivotal shifts around the 1/2 mark of both price and time, fondly naming it the “Grand Center” — a spot where key angles and price levels converged.
In Gann’s eyes, here’s the hierarchy of significance:
- The pinnacle — the ‘End’ of the Square, where price and time rendezvous, often sparking change.
- The Midpoint, also known as 1/2 or the ‘Grand Center’ — a launchpad for shifts, with higher lows if the Square kicks off low, and lower highs if it originates high.
- Next in line, are the 1/3 and 2/3 divisions, their dance often fosters equilibrium.
- Then, the 1/4 and 1/8 milestones, each orchestrating a rhythm of transformation. This symphony rings true for both PRICE and TIME.
Interestingly, despite the ever-changing market landscape, Gann’s ‘Square’ still finds its groove, attuning precisely to real-time rhythms. As proof, cast your eyes on March 1987: in the realm of interest rates, the illustrious TBONDS futures contract brought Gann’s vision to life. Overlaying the Square of 144 on a Weekly September TBond chart—a digital homage to Gann’s methods—the Square revealed its true colors.
Here’s where the journey began: June 1984 marked the inception of the Square of 144, aligning with a major low in TBonds. A mirror image of our blueprint, this digital overlay is divided into eighths and thirds both vertically and horizontally. Cast your gaze to October 5th, 1984—a faint echo of the 1st 1/8 in Time, as prices pulled back for a week, dancing to the same rhythm.
So, there you have it—a dance of price and time, a symphony that has spanned decades, an orchestra of market magic that still resonates today.
Following the earlier dip, prices resumed their ascent, hitting a halt precisely at the 1/3 price demarcation, a mere week before the 1/4 time fraction came into play. As time rolled on, at the 3/8 juncture, prices came tantalizingly close to reaching the 1/2 or Midpoint in price, stationed at 80. Yet, from there, prices retraced their steps, aligning with the rhythm of the calendar. Just before the Midpoint or 1/2 in Time came knocking (on 10/18/85), the stage was set for another higher low. Picture this: a market rhythmically choreographed on a weekly scale, impeccably echoing Gann’s vision. In an ascending market, the spotlight shifted to the “Grand Center” or the Midpoint in the Square, where a transformative trend change often unfolded.
A surge of momentum surged post the Midpoint lull, propelling prices upward to the Square’s zenith—a zone of formidable price resistance, breached dramatically in April 1986, just as the 2/3 Time juncture drew near. This climactic summit received affirmation through another of Gann’s tools. On April 17, 1986, the price peak at 104 aligned beautifully with the all-time high from 1977, a Gann-style “squaring of price & time” etched on the Sep TBond MONTHLY chart. This hinted at a seismic trend reversal for TBonds (from rise to decline), while 48 WEEKS remained in the Square of 144, the denouement scheduled for the week ending 3/6/87.
But the story takes a noticeable twist after the pivotal highs of April ’86. A 96-week journey (2/3 within the Square of 144) turned volatile, marked by a significant plunge from 1-4 to 9116, a brief resurgence to a lower high at 102 in August ’86, and then descending again to a lower low at 90 in September ’86. As the once-steely ascent wavered, alarms were raised in January and February ’87. Even amidst a bustling stock market, weekly price ranges dwindled, and the Square of 144 was inching towards its time-bound finale (having reached its price zenith in April ’86).
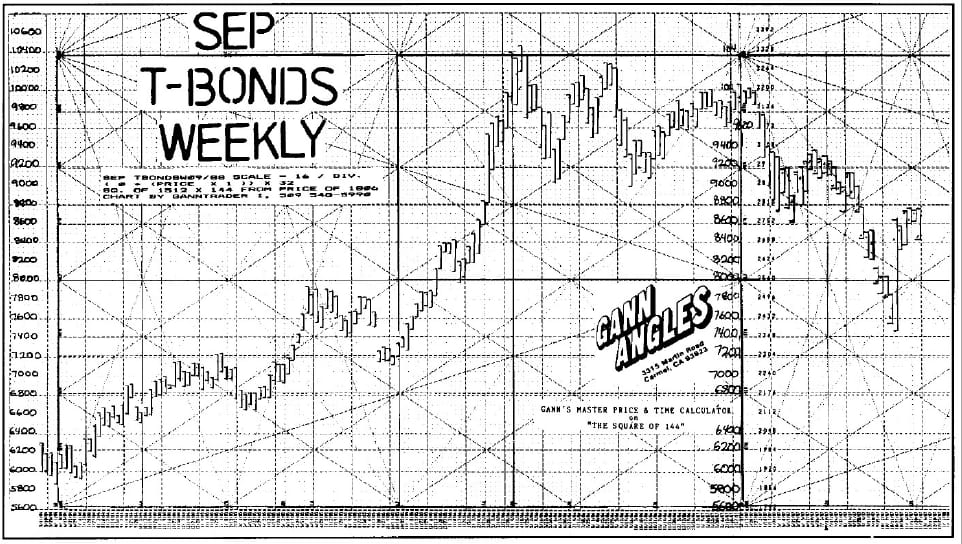
The climax unfolded on March 5, 1987, when the magic of Mr. Gann’s methodologies was spotlighted once again. The TBonds gracefully formed a 3rd lower peak, aligning EXACTLY WITH THE END OF THE WEEKLY SQUARE OF 144. Imagine holding the key to this insight—a year prior, the informed trader could confidently predict the opportune moment to short near the top. As futures aligned with the Square’s rhythm for nearly three years, the significance of this foresight comes to light. Ponder the impact it could have had on brokerage houses that suffered massive losses in the wake of the “End of the Square.”
However, the Square’s influence doesn’t conclude with its zenith. Instead, it evolves into a roadmap for the future, plotting upcoming price dynamics and time. TBonds embarked on their third Square of 144 since the 1981 low. Since the first two squares distinctly favored an upward bullish trajectory, Gann’s principles hint at a shift to a bearish downtrend in this chapter. An examination of the initial decline in April/May ’87, touching the 5/8 price threshold at 8600 and subsequently meeting the 3/8 division at 7400, only underscores the unwavering accuracy of the previous two Squares. And as the 2/3 Time frame heralded the peak in the second Square, Gann’s equilibrium principle beckons attention toward a significant low at the 1/3 point in this new Square (2/5/88).